StockMonitor

Dein Wertschriftendepot
Endlich professionell analysiert.

Your securities portfolio
Finally professionally analysed.

Stock Monitor ist eine leistungsstarke Desktop-App für Privatanleger mit Charts, KI-Analyse, geführtem CSV-Import, Steuer-Assistent und mehr. Aktien, ETFs und Kryptowährungen auf einen Blick. Kursdaten via Yahoo Finance (15 Min. verzögert). Für Privatanleger kostenlos. Open Source.

Stock Monitor is a powerful desktop app for private investors with charts, AI analysis, guided CSV import, tax assistant and more. Stocks, ETFs and cryptocurrencies at a glance. Price data via Yahoo Finance (~15 min. delayed). Free for private investors. Open Source.

🪟 Download für Windows 🪟 Download for Windows
ZIP entpacken → .exe starten · Kein Setup
Erster Start ~20 Sek.
Extract ZIP → run .exe · No setup
First launch ~20 sec.
🐧 Download für Linux 🐧 Download for Linux
.rpm verfügbar (Fedora, openSUSE, Nobara)
.rpm available (Fedora, openSUSE, Nobara)
Features entdecken ↓ Explore Features ↓
Open Source · Schweiz 🇨🇭
Open Source · Switzerland 🇨🇭
16× Charts gleichzeitig Charts simultaneously
5 Steuer-Assistent für 5 Länder Tax Assistant for 5 Countries
27+ Währungen, Kryptowährungen & Edelmetalle Currencies, Cryptos & Precious Metals
10K Monte Carlo Pfade Monte Carlo Paths
AES-256 Verschlüsselung nach Bankenstandard Bank-grade Encryption
DE / EN Vollständig bilingual Fully bilingual
🔒
Deine Daten bleiben lokal
Dein Portfolio wird verschlüsselt auf deinem Gerät gespeichert. Nichts verlässt deinen Computer.
🚫
Keine Telemetrie
Kein Tracking, keine Analytics, keine Nutzerdaten. Keinerlei Werbung — jetzt nicht und niemals.
🇨🇭
Made in Switzerland
Entwickelt von einem Privatanleger für Privatanleger — mit Fokus auf Datenschutz und Qualität.
Kostenlos & Open Source
Vollständig gratis, kein Abo, kein Freemium. Der Quellcode ist offen einsehbar auf GitHub.
📥
CSV-Import mit geführtem Mapping
Deine Bank dabei? Einfach importieren. Format unbekannt? In wenigen Klicks die Spalten zuordnen — Stock Monitor führt dich Schritt für Schritt.
📋
Portfolio-Bewertung
Regelbasierte Bewertung: Diversifikation, Klumpenrisiken, GICS-Sektoren, Stärken und Schwächen — ohne KI, ohne Cloud.
🔒
Data stays local
Your portfolio is encrypted and stored on your device only. Nothing leaves your computer.
🚫
No telemetry
No tracking, no analytics, no user data. Zero ads — now and forever.
🇨🇭
Made in Switzerland
Built by a private investor for private investors — with a focus on privacy and quality.
Free & Open Source
Completely free, no subscription, no freemium. Source code is fully open on GitHub.
📥
CSV Import with Guided Mapping
Your bank supported? Just import. Unknown format? Map your columns in a few clicks — Stock Monitor walks you through it step by step.
📋
Portfolio Assessment
Rule-based assessment: diversification, concentration risks, GICS sectors, strengths and weaknesses — without AI, without cloud.
Das Dashboard
The Dashboard
Bis zu 16 Charts auf einen Blick
Up to 16 Charts at a Glance

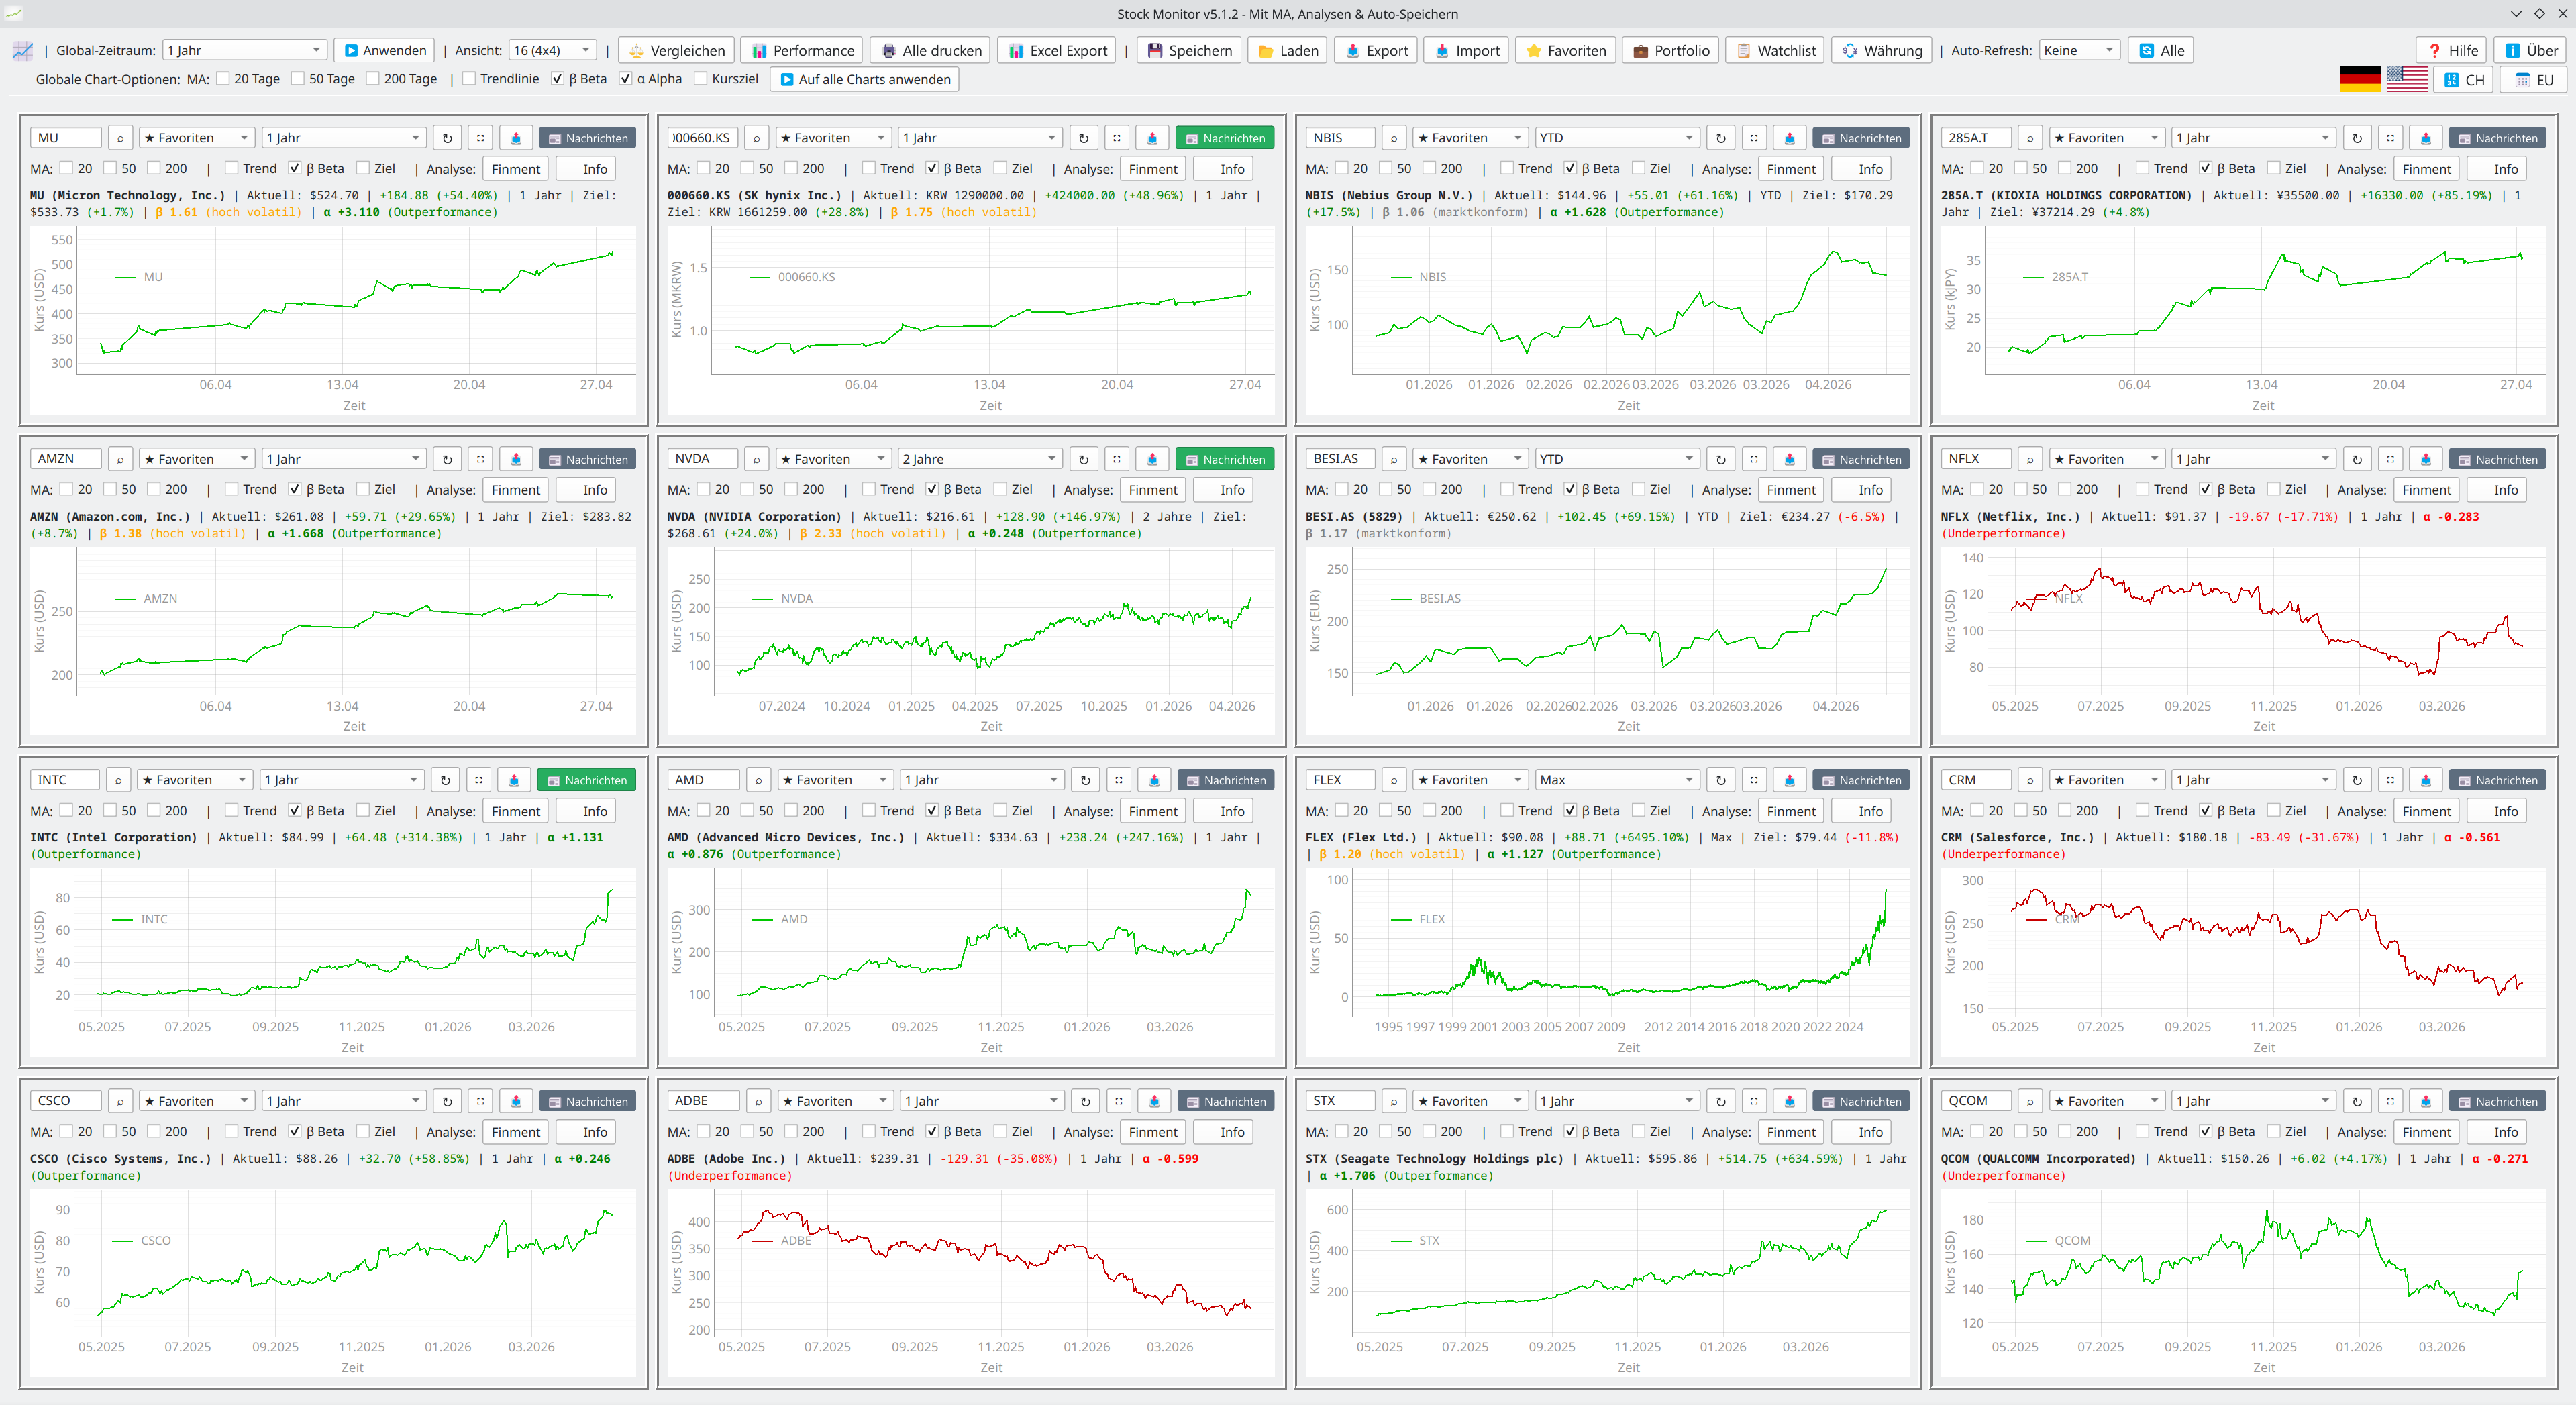
Behalte alle deine Positionen simultan im Überblick — mit Moving Averages, Trendlinien, RSI, Bollinger Bands, Beta, Alpha und Sharpe Ratio. Zoom in jeden Chart für Detailanalysen.

Monitor all your positions simultaneously — with Moving Averages, trend lines, RSI, Bollinger Bands, Beta, Alpha and Sharpe Ratio. Zoom into any chart for detailed analysis.

Stock Monitor Dashboard
Stock Monitor v5.3.1 ·16 Charts · MA 20/50/200 · Trend · Beta · KI-Analyse · Yahoo Finance · Steuer-Assistent CH/DE/AT/UK/US
Stock Monitor v5.3.1 ·16 Charts · MA 20/50/200 · Trend · Beta · AI Analysis · Yahoo Finance · Tax Assistant CH/DE/AT/UK/US
Portfolio
Übersicht Overview

📊 Portfolio-Übersicht

📊 Portfolio Overview

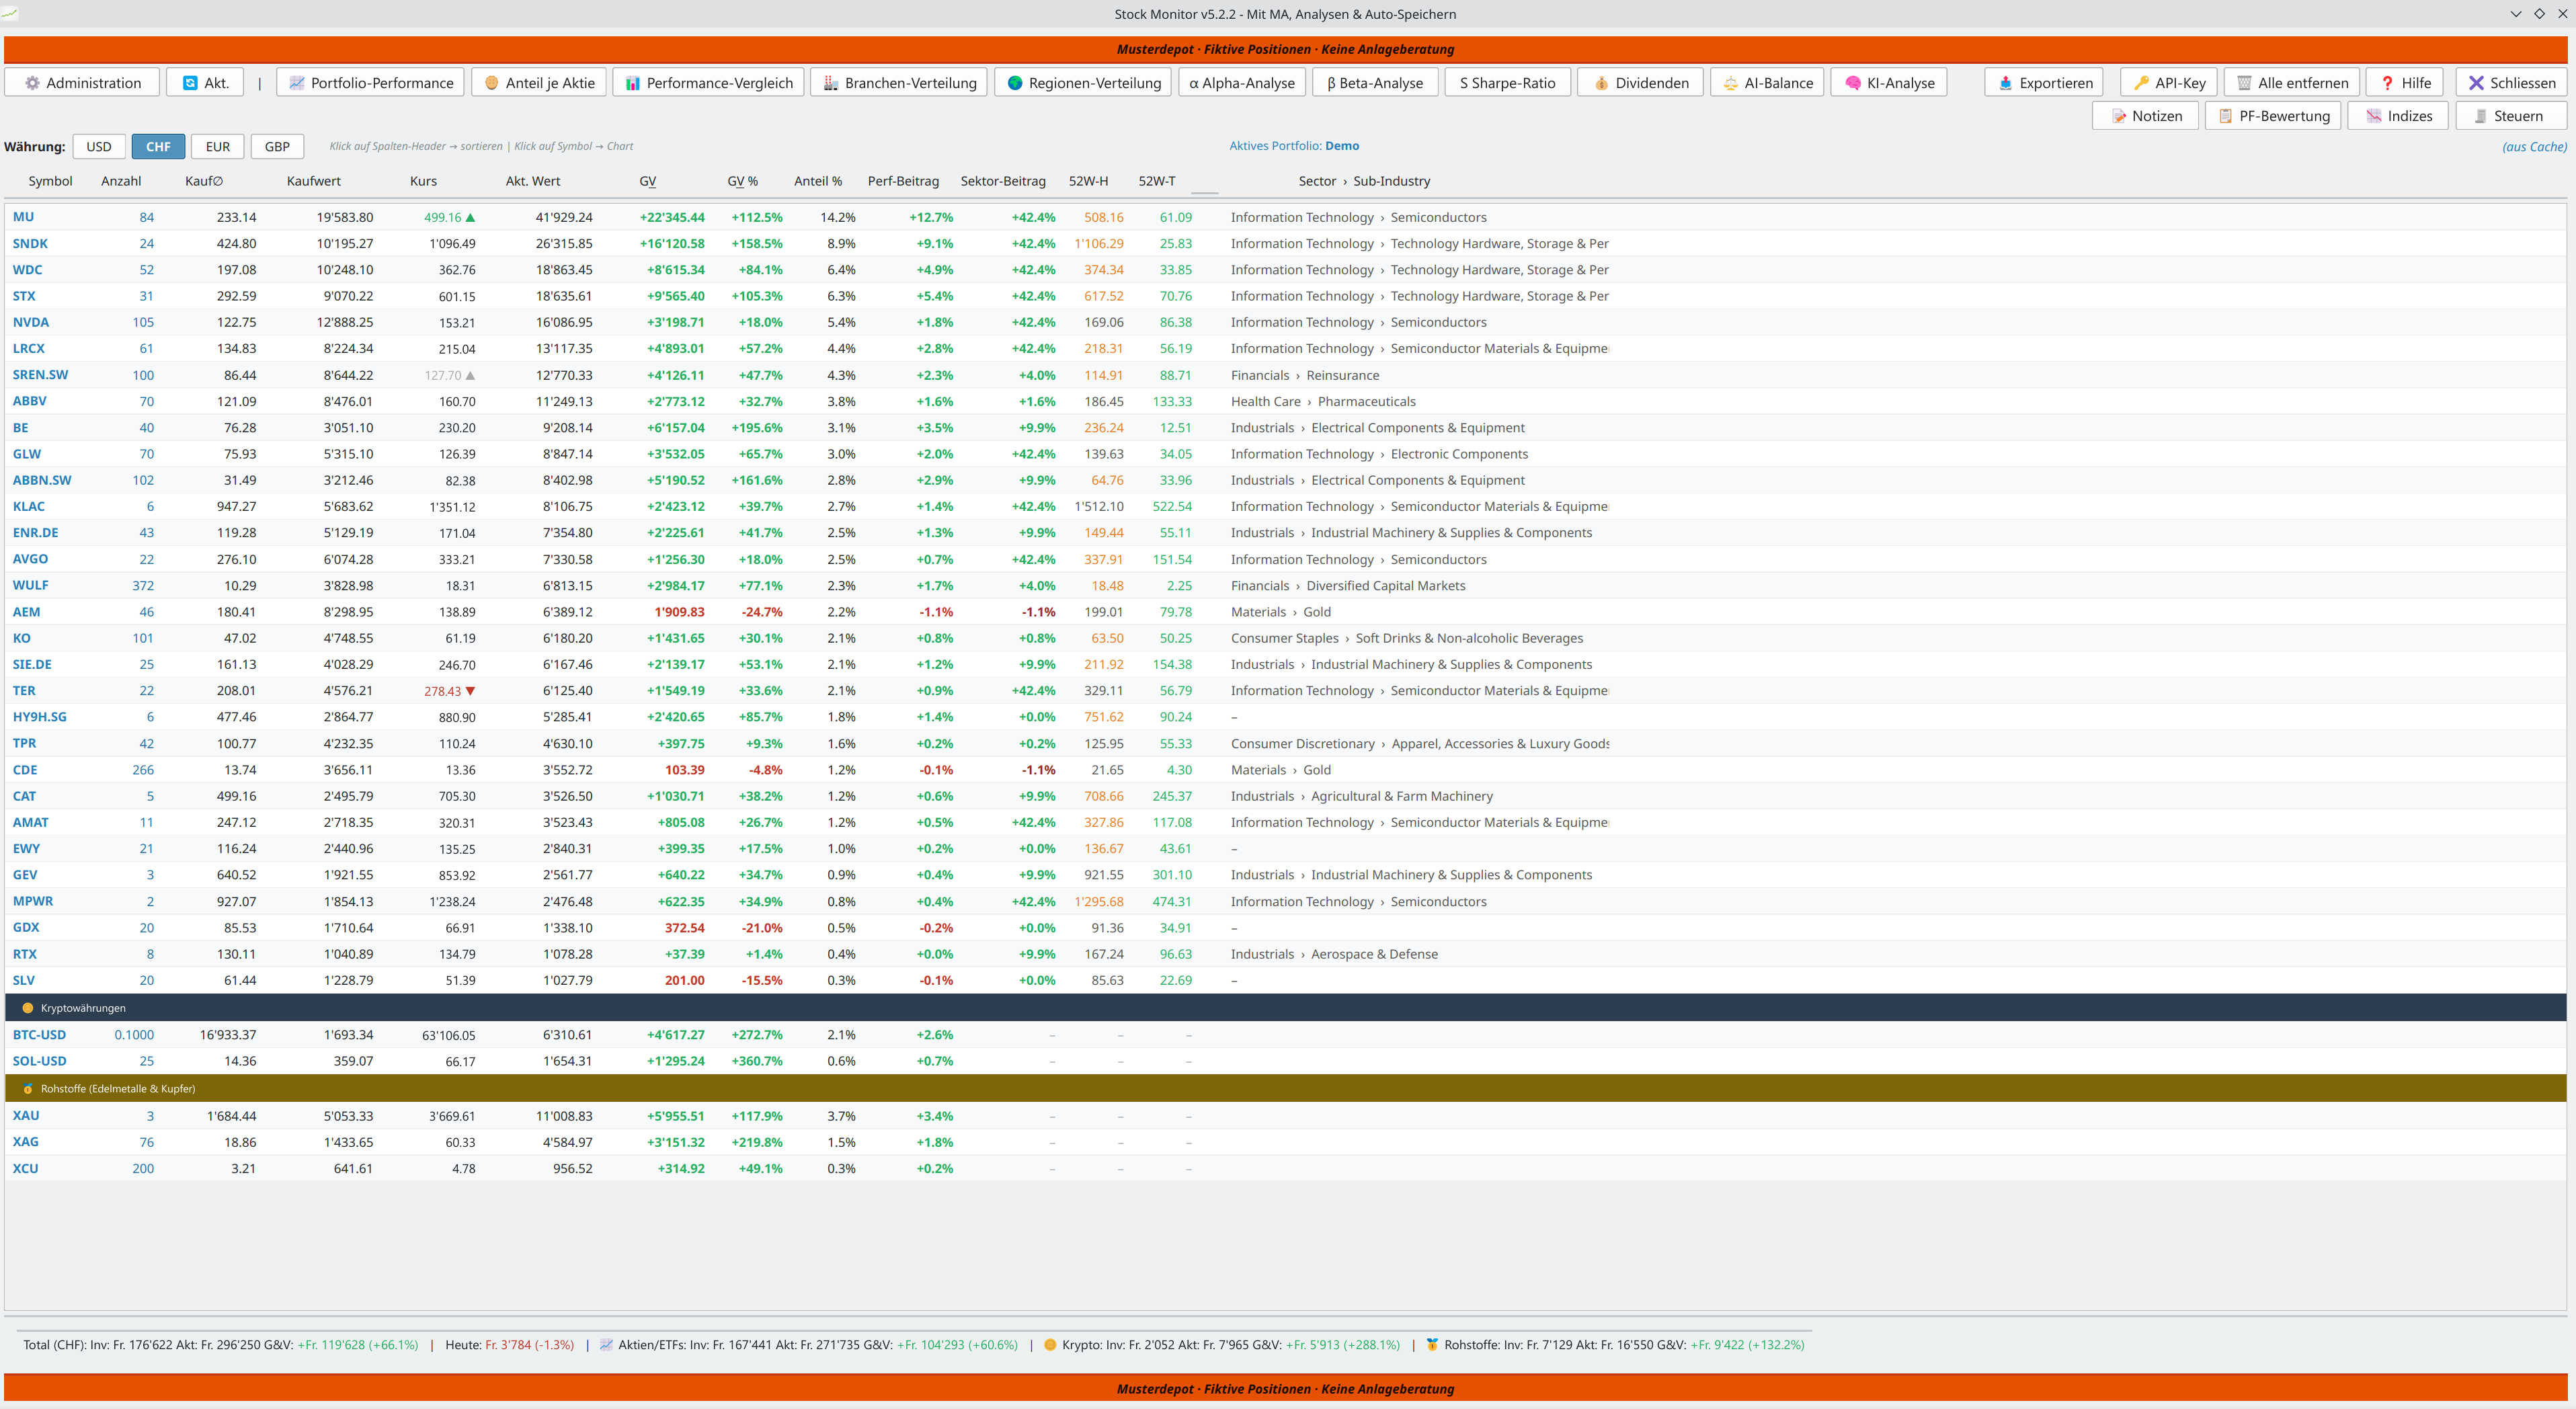
Vollständige Übersicht mit Einstandspreis, Tageswert, aktuellem Wert, P&L, Gewichtung, Sektorzuordnung (GICS) und 52-Wochen-Hoch/Tief. In einer Ansicht: Aktien, ETFs, Kryptowährungen und Edelmetalle.
Und vieles mehr.

Complete overview with average cost basis, daily value, current value, P&L, weight, sector assignment (GICS) and 52-week high/low. In one view: stocks, ETFs, cryptocurrencies and precious metals.
And much more.

Portfolio Bewertung
Portfolio-Bewertung Portfolio Assessment

📋 Portfolio-Bewertung — auf einen Blick

📋 Portfolio Assessment — at a Glance

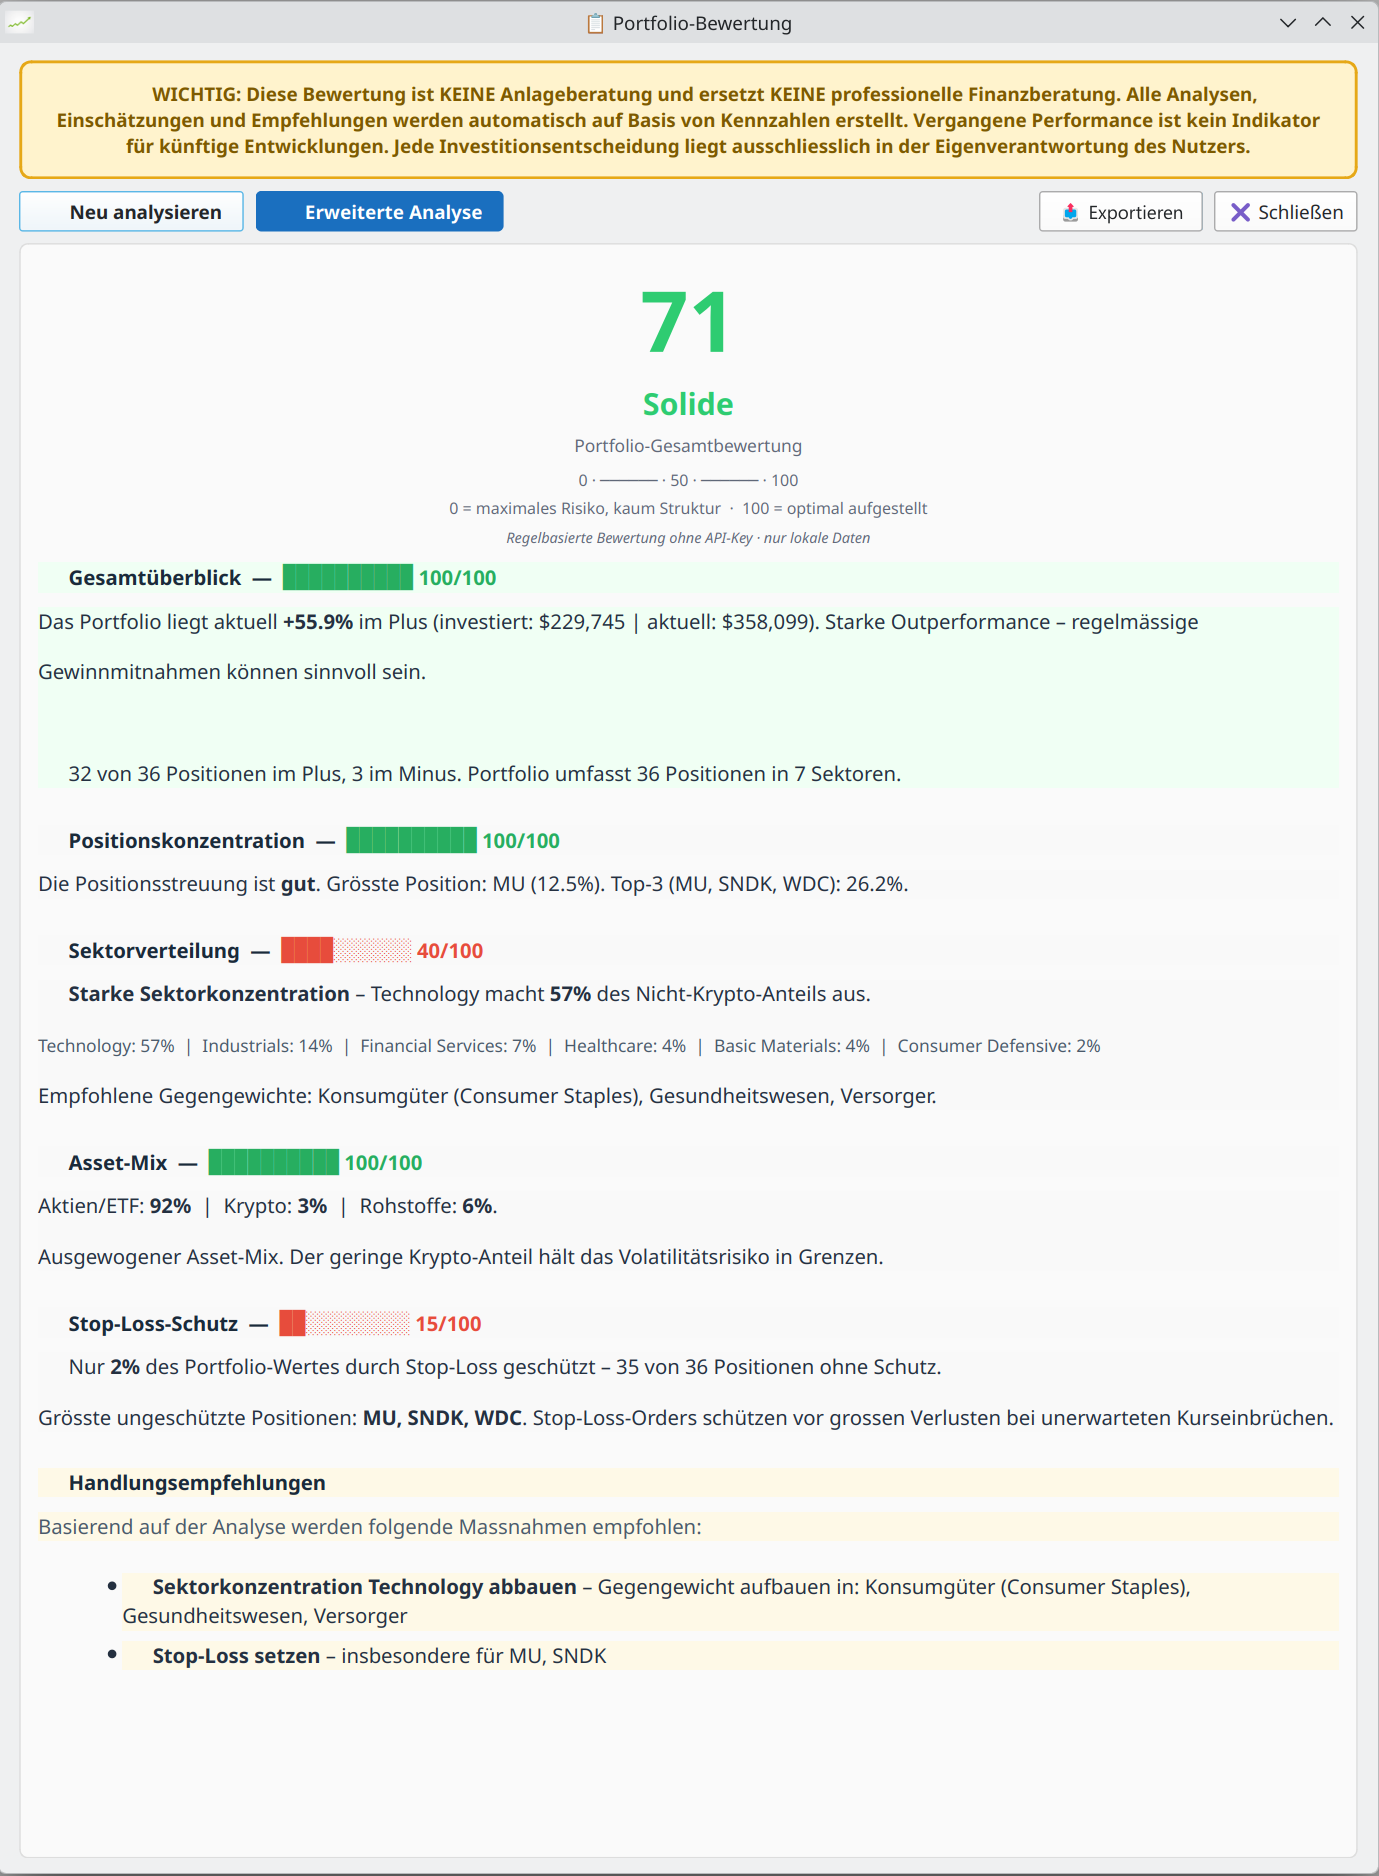
Sofortige Gesamteinschätzung deines Portfolios: Wie gut diversifiziert bist du wirklich? Stock Monitor bewertet automatisch Sektorverteilung, Klumpenrisiken und Stärken — übersichtlich zusammengefasst, ohne manuellen Aufwand. Keine KI, keine Cloud — rein regelbasiert auf deinen eigenen Daten.

Instant overall assessment of your portfolio: how well diversified are you really? Stock Monitor automatically evaluates sector distribution, concentration risks and strengths — clearly summarised, without any manual effort. No AI, no cloud — purely rule-based on your own data.

  • GICS-Sektoren-Analyse: Verteilung und Klumpenrisiken
  • GICS sector analysis: distribution and concentration risks
  • Stärken & Schwächen automatisch identifiziert
  • Strengths & weaknesses automatically identified
  • Regionale Diversifikation über die interaktive Weltkarte
  • Regional diversification via the interactive world map
  • Kein API-Key, kein Account erforderlich
  • No API key, no account required
Performance
Portfolio-Analyse Portfolio Analysis

📈 Portfolio Performance

📈 Portfolio Performance

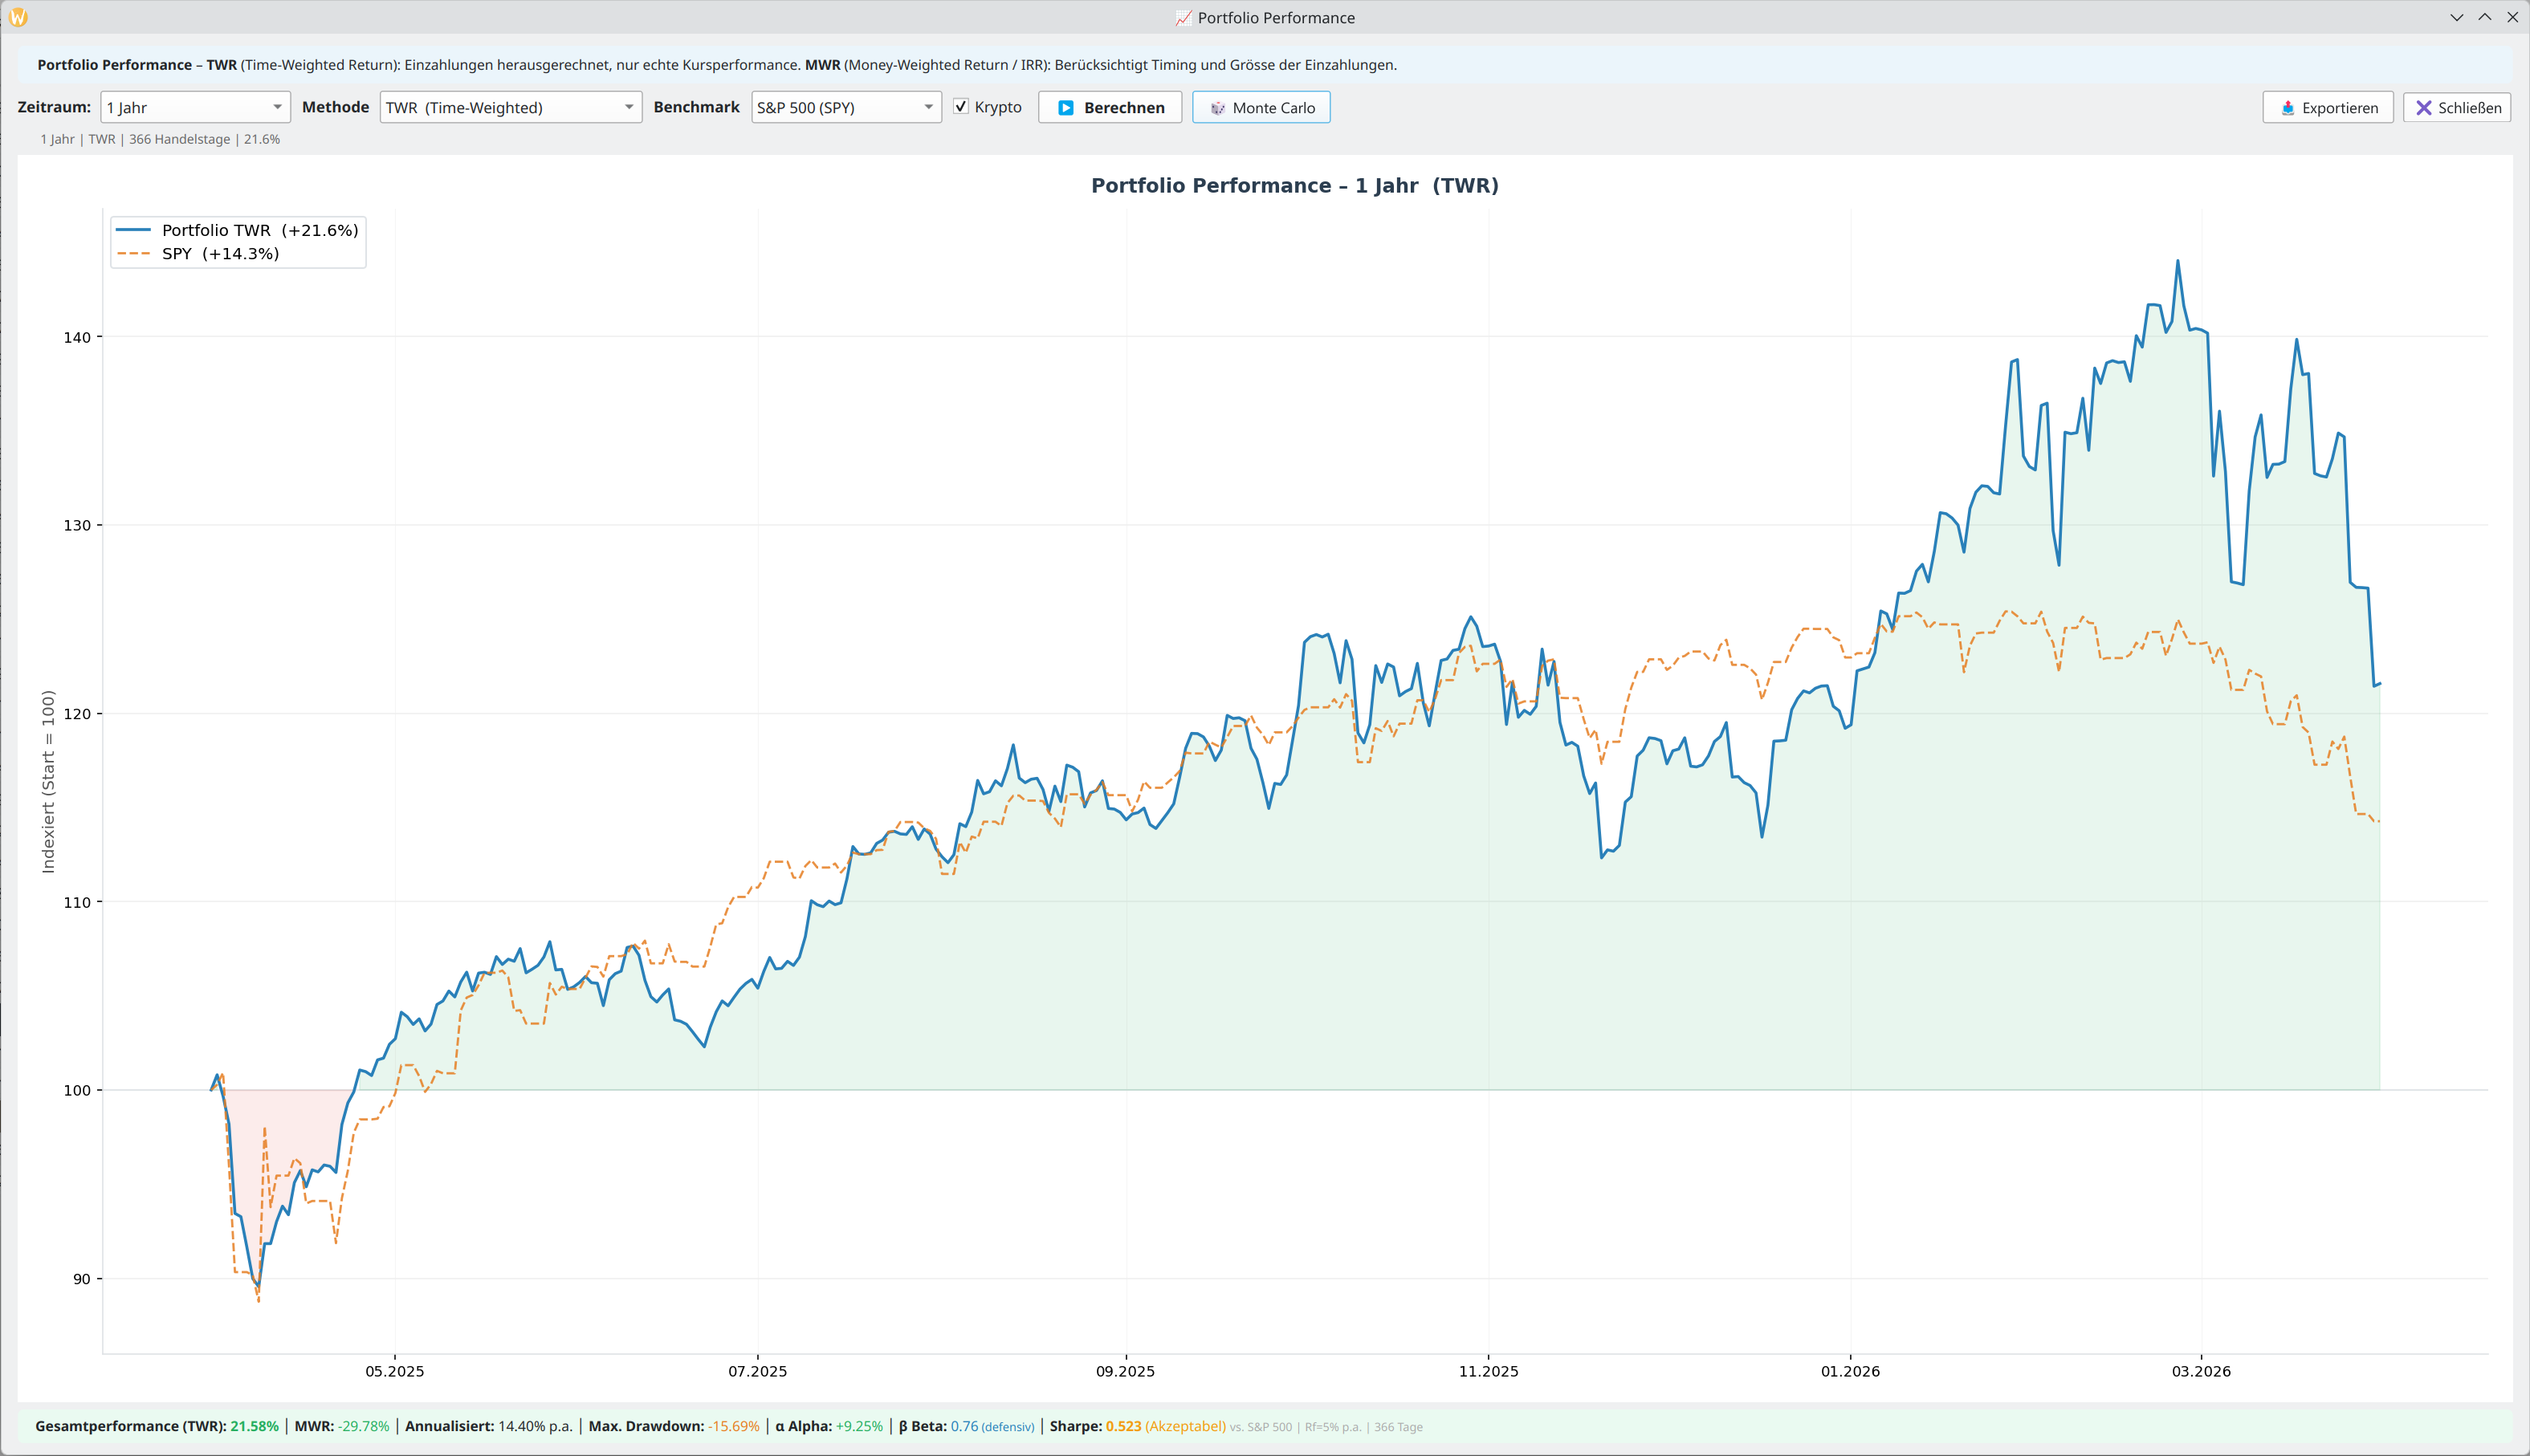
TWR und MWR (IRR) Berechnung.
Vergleich mit den wichtigsten Benchmark-Indizes (S&P 500, SMI, DAX und mehr).
Alpha, Beta, Sharpe Ratio und Max. Drawdown werden automatisch berechnet.

TWR and MWR (IRR) calculation.
Comparison with the most important benchmark indices (S&P 500, SMI, DAX and more).
Alpha, Beta, Sharpe Ratio and Max. Drawdown are calculated automatically.

AI Balance
KI-Analyse AI Analysis

⚖️ AI Balance & Rebalancing

⚖️ AI Balance & Rebalancing

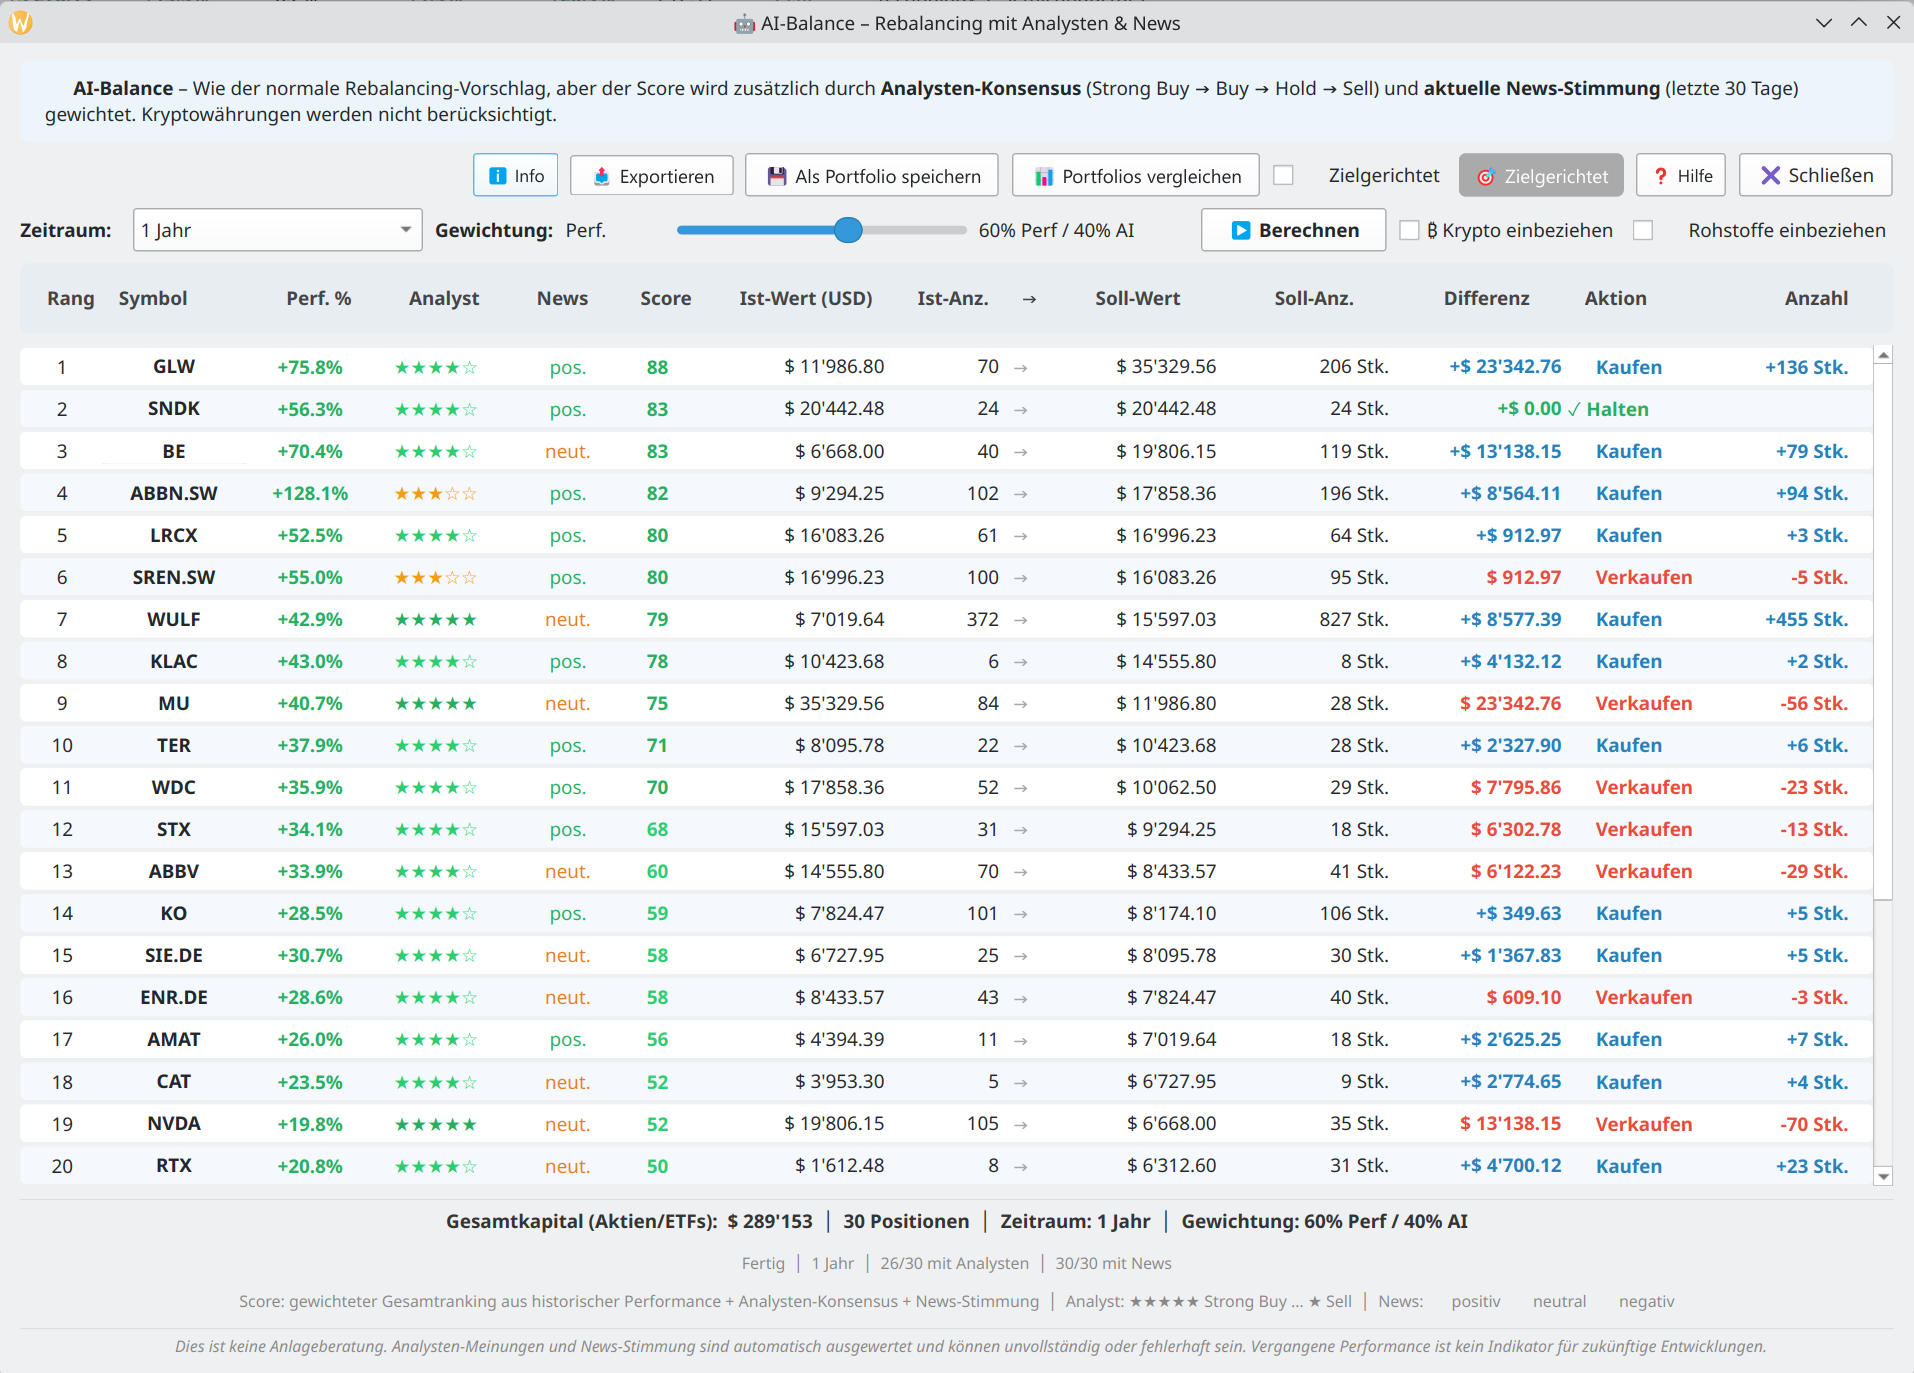
Auf Wunsch KI-gestütztes Rebalancing kombiniert historische Performance mit Analysten-Konsensus (Strong Buy→Sell) und aktuellem News-Sentiment der letzten 30 Tage. KI-Unterstützung kann jederzeit ausgeschaltet werden. Zielgerichtetes Rebalancing mit Filter nach GICS-Sektor oder Währung möglich.

Optionally AI-powered rebalancing combines historical performance with analyst consensus (Strong Buy→Sell) and current news sentiment of the last 30 days. AI support can be disabled at any time. Targeted rebalancing with filtering by GICS sector or currency is supported.

Dividends
Dividenden Dividends

📅 Dividenden-Kalender

📅 Dividend Calendar

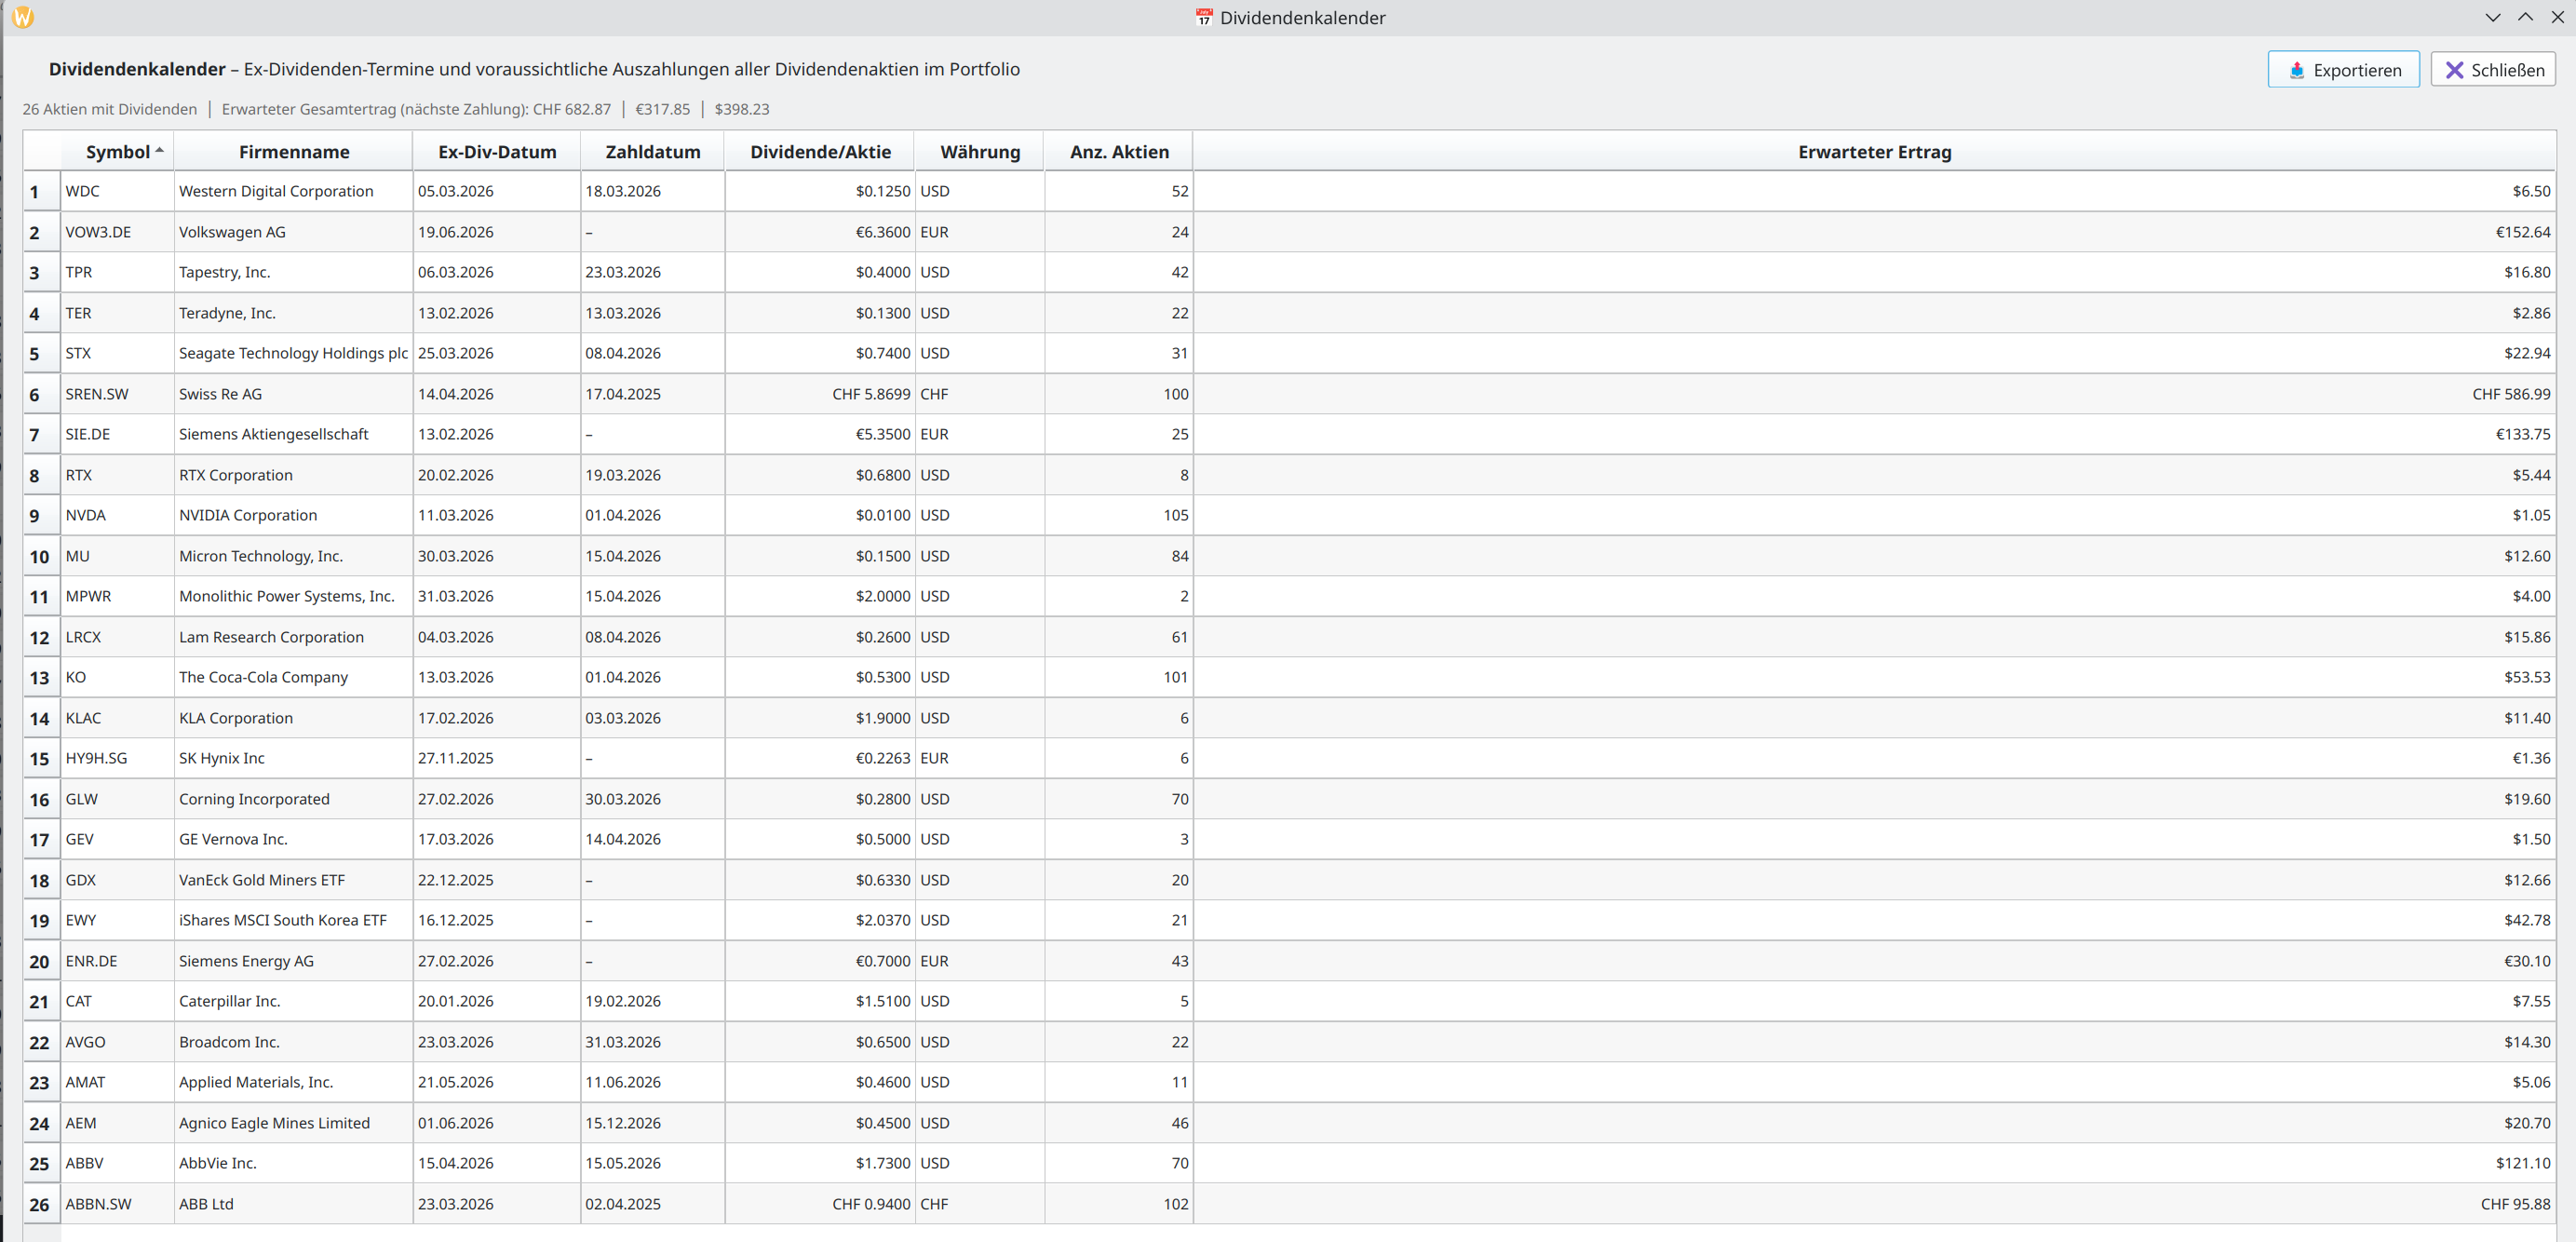
Alle Dividendenzahlungen deines Portfolios auf einen Blick: Ex-Div-Termine, Zahltage, Dividende je Aktie und erwarteter Gesamtertrag.
Geordnet nach nächstem Zahlungsdatum.

All dividend payments in your portfolio at a glance: ex-div dates, pay dates, dividend per share and expected total yield.
Sorted by next payment date.

Dividend History
Dividendenhistorie Dividend History

💰 Dividendenhistorie & Wachstums-Analyse

💰 Dividend History & Growth Analysis

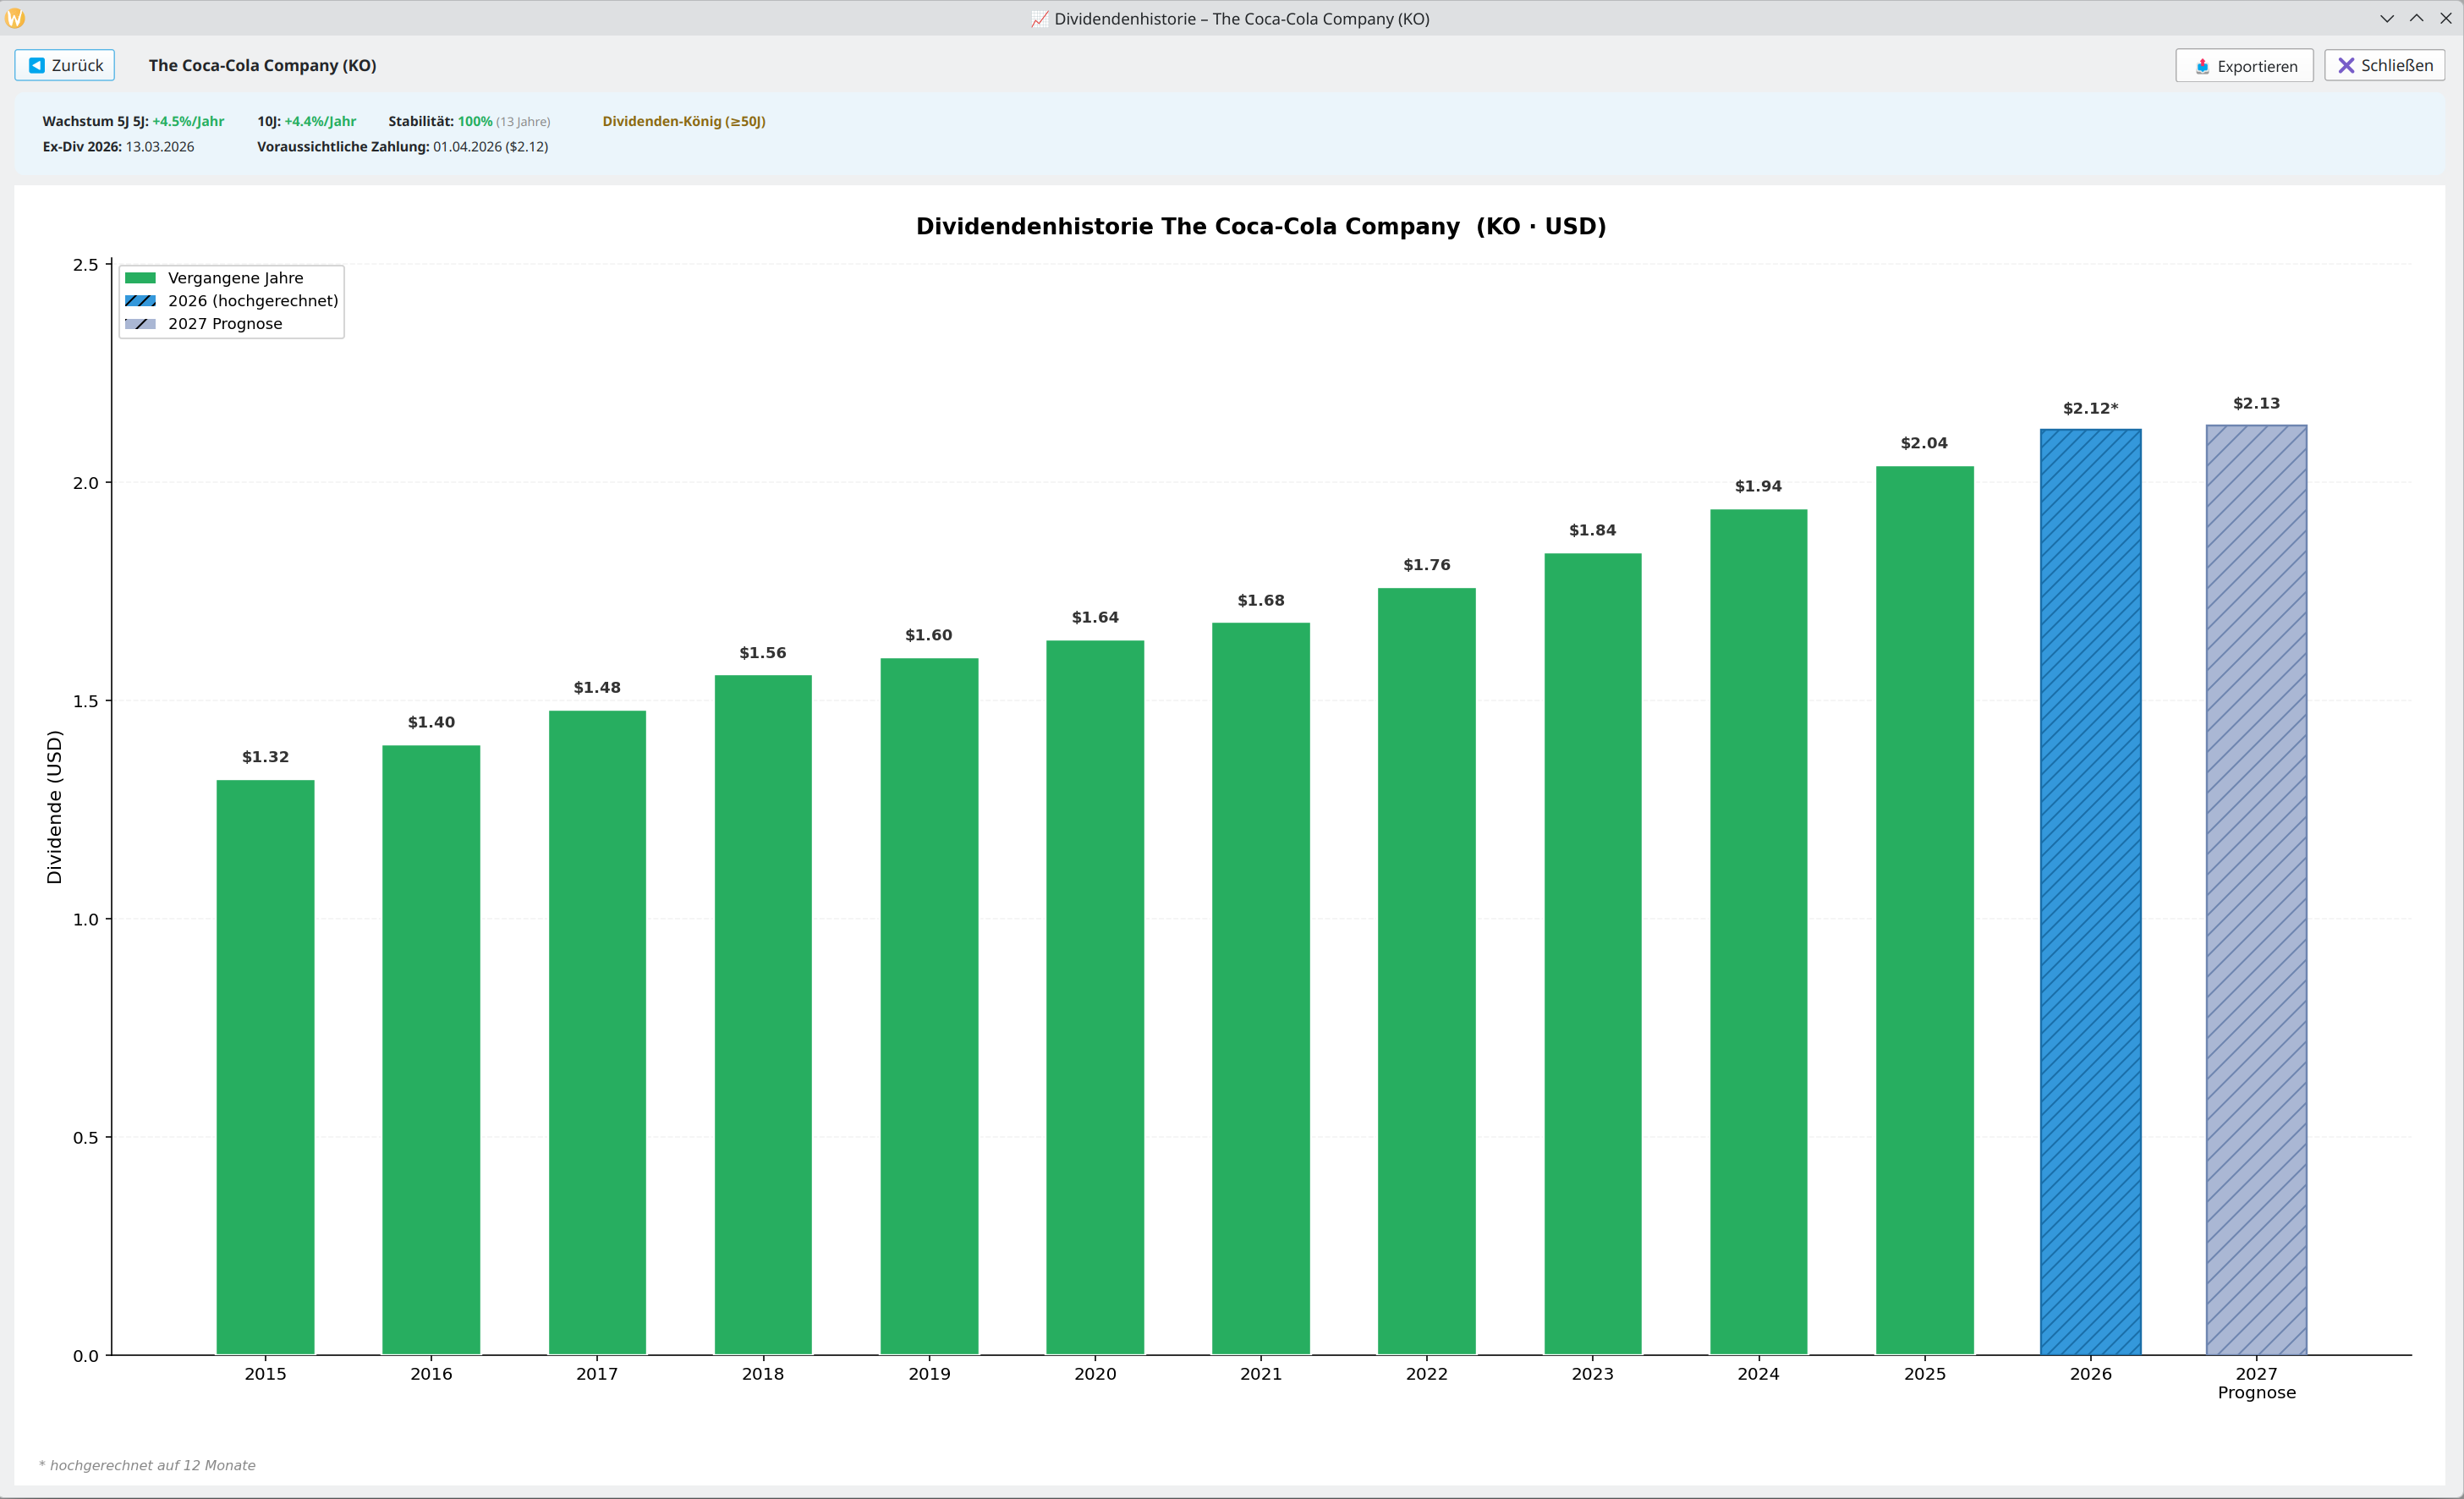
Detaillierte Verlaufshistorie aller Dividendenzahlungen mit automatisch berechnetem Wachstum, Stabilität und Forecast. Sehe auf einen Blick, wie verlässlich ein Titel ausschüttet.

Detailed history of all dividend payments with automatically calculated growth rate, stability score and forecast. See at a glance how reliably a stock pays out.

  • Jährliches & mehrjähriges Dividendenwachstum (CAGR)
  • Annual & multi-year dividend growth (CAGR)
  • Stabilitätsbewertung und Payout-Analyse
  • Stability rating and payout analysis
  • Dividenden-Forecast basierend auf historischen Daten
  • Dividend forecast based on historical data
World Map
Visualisierung Visualization

🌍 Regionen-Weltkarte

🌍 Regional World Map

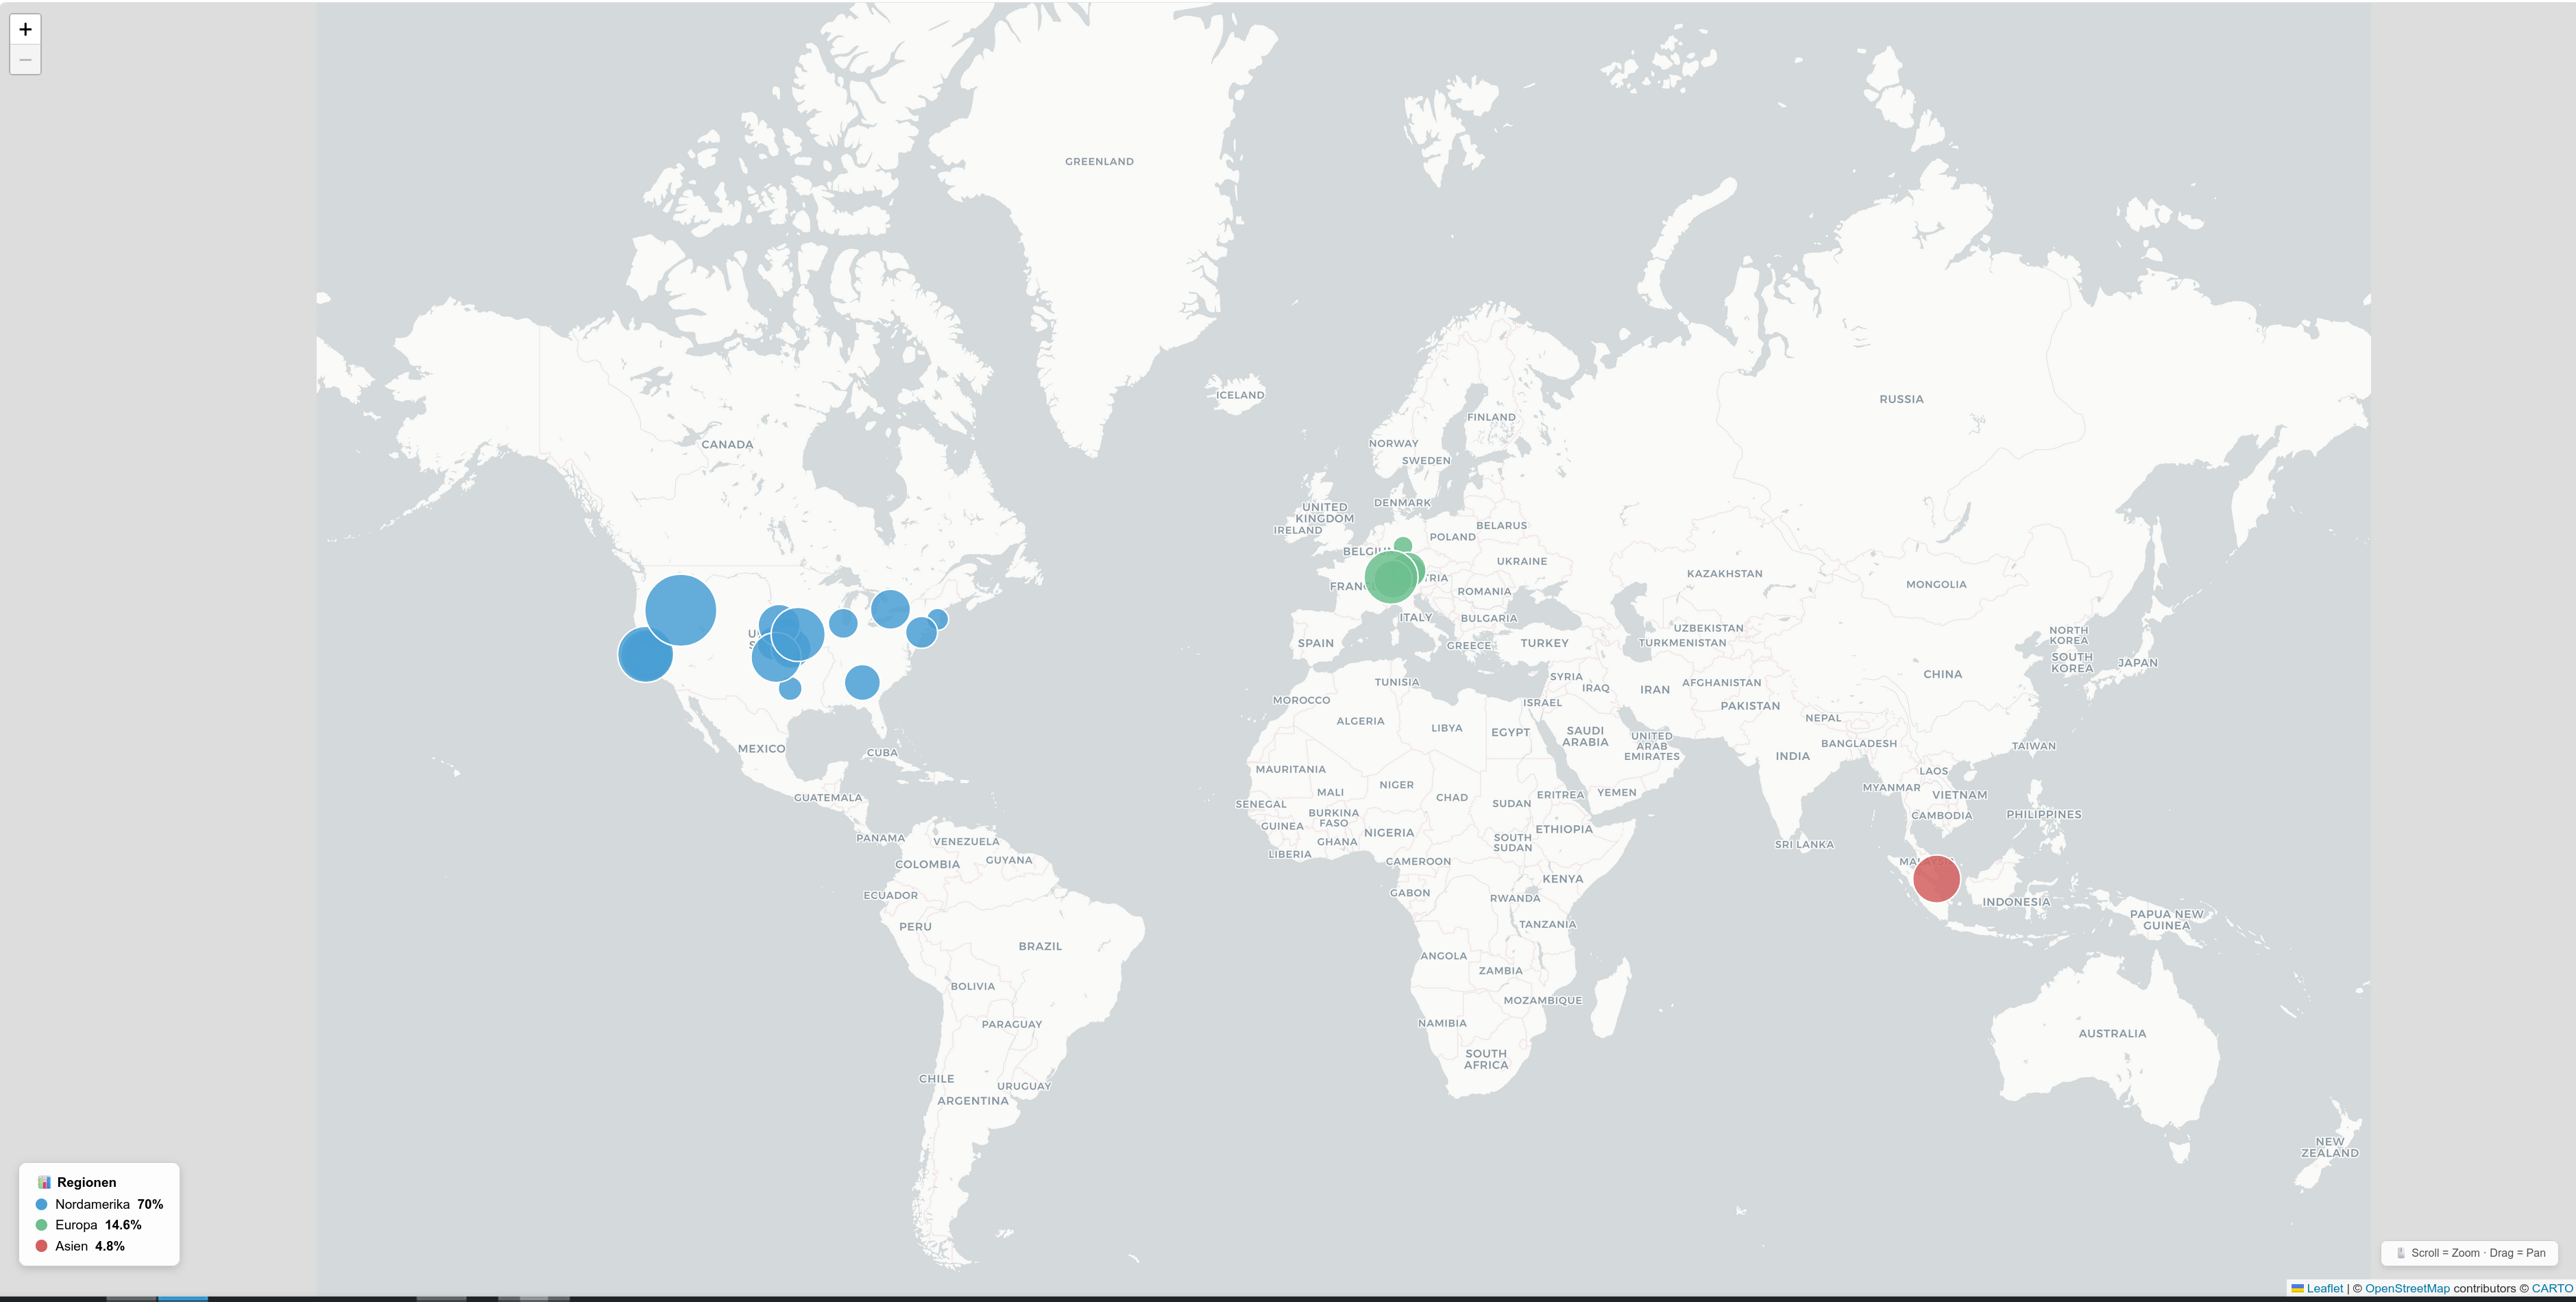
Interaktive Weltkarte zeigt deine geografische Portfolio-Verteilung. Klick auf einen Marker öffnet Details zur Position inkl. Firmenadresse und Website.

Interactive world map shows your geographic portfolio distribution. Click a marker to open position details including company address and website.
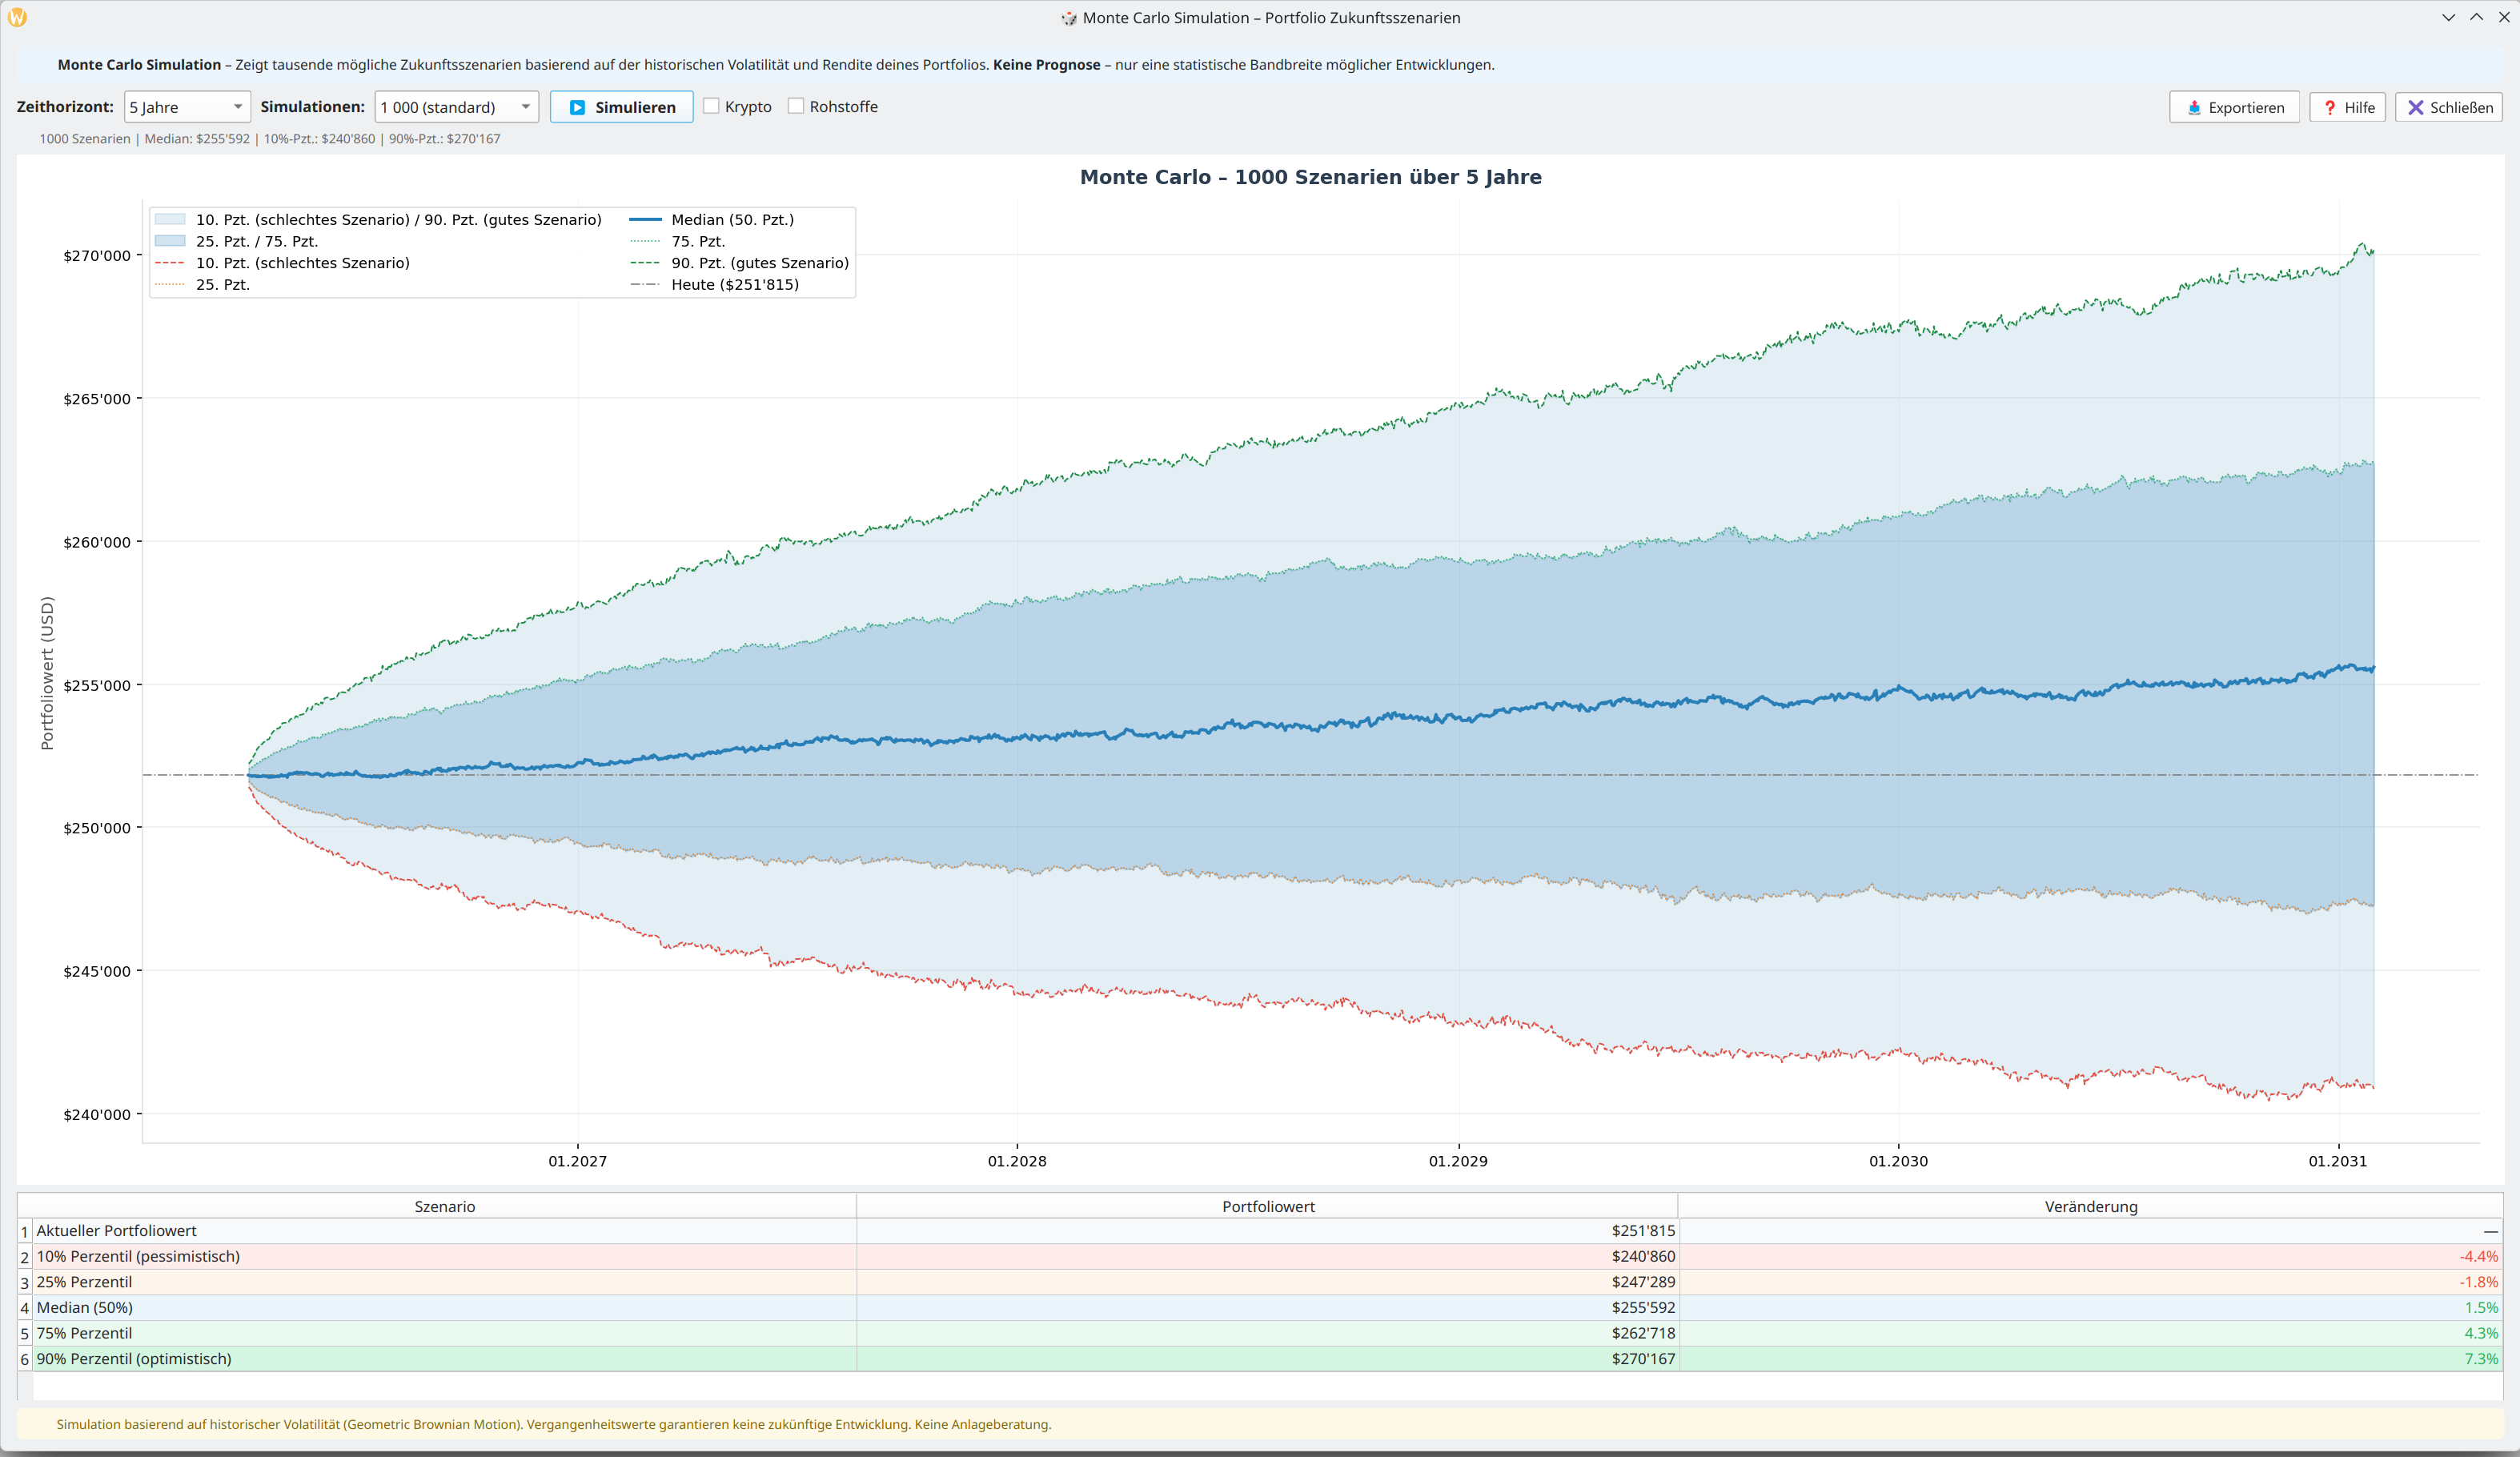
Excess CAPE Yield
Marktbewertung Market Valuation

📊 Excess CAPE Yield (ECY)

📊 Excess CAPE Yield (ECY)

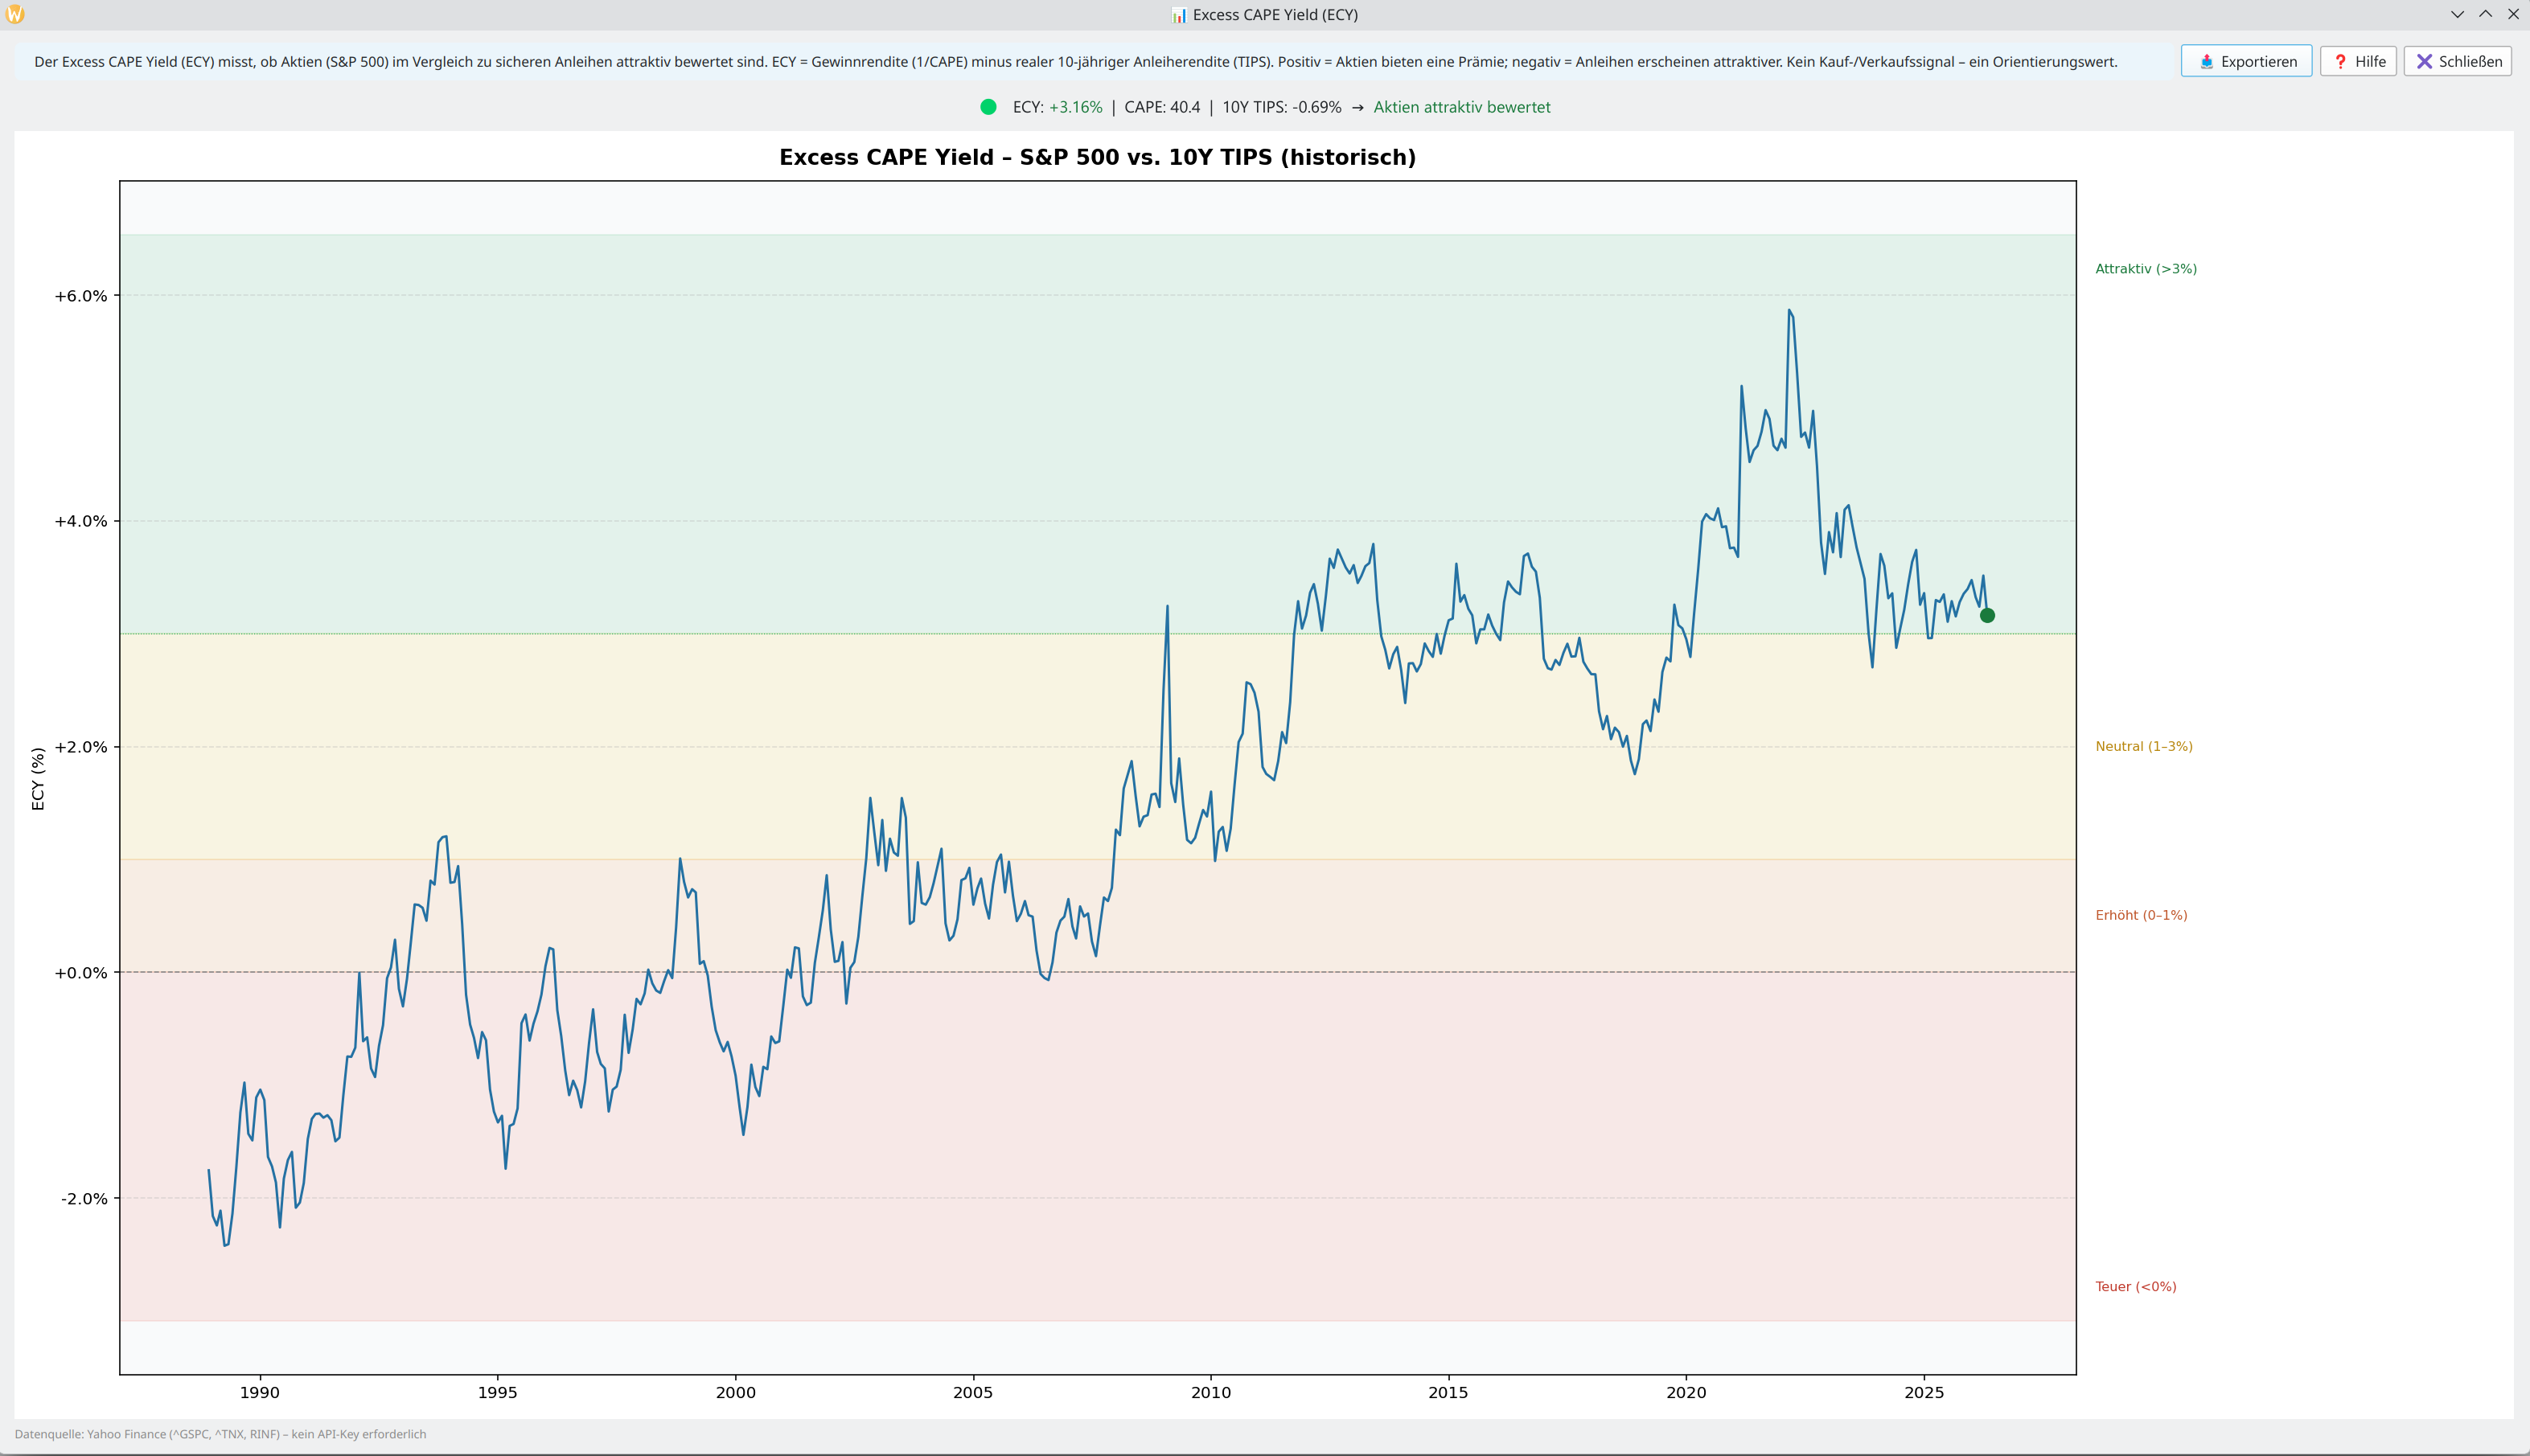
Ist der Aktienmarkt aktuell günstig oder teuer — im Vergleich zu sicheren Anleihen? Der ECY (Gewinnrendite minus realer 10J-Anleiherendite) gibt eine historisch validierte Antwort. Mit farbigen Bewertungszonen und Chart seit 1988.

Is the stock market currently cheap or expensive — compared to safe bonds? The ECY (earnings yield minus real 10Y bond yield) gives a historically validated answer. With colour-coded valuation zones and chart since 1988.

  • 🟢 >3% attraktiv · 🟡 1–3% neutral · 🟠 0–1% erhöht · 🔴 <0% teuer
  • 🟢 >3% attractive · 🟡 1–3% neutral · 🟠 0–1% elevated · 🔴 <0% expensive
  • Kein API-Key — Daten direkt via Yahoo Finance berechnet
  • No API key — data calculated directly via Yahoo Finance
  • Kein Kauf-/Verkaufssignal, sondern ein langfristiger Orientierungswert
  • Not a buy/sell signal — a long-term orientation value
Sharpe Ratio
Risiko-Analyse Risk Analysis

⚖️ Sharpe, Alpha & Beta — automatisch berechnet

⚖️ Sharpe, Alpha & Beta — calculated automatically

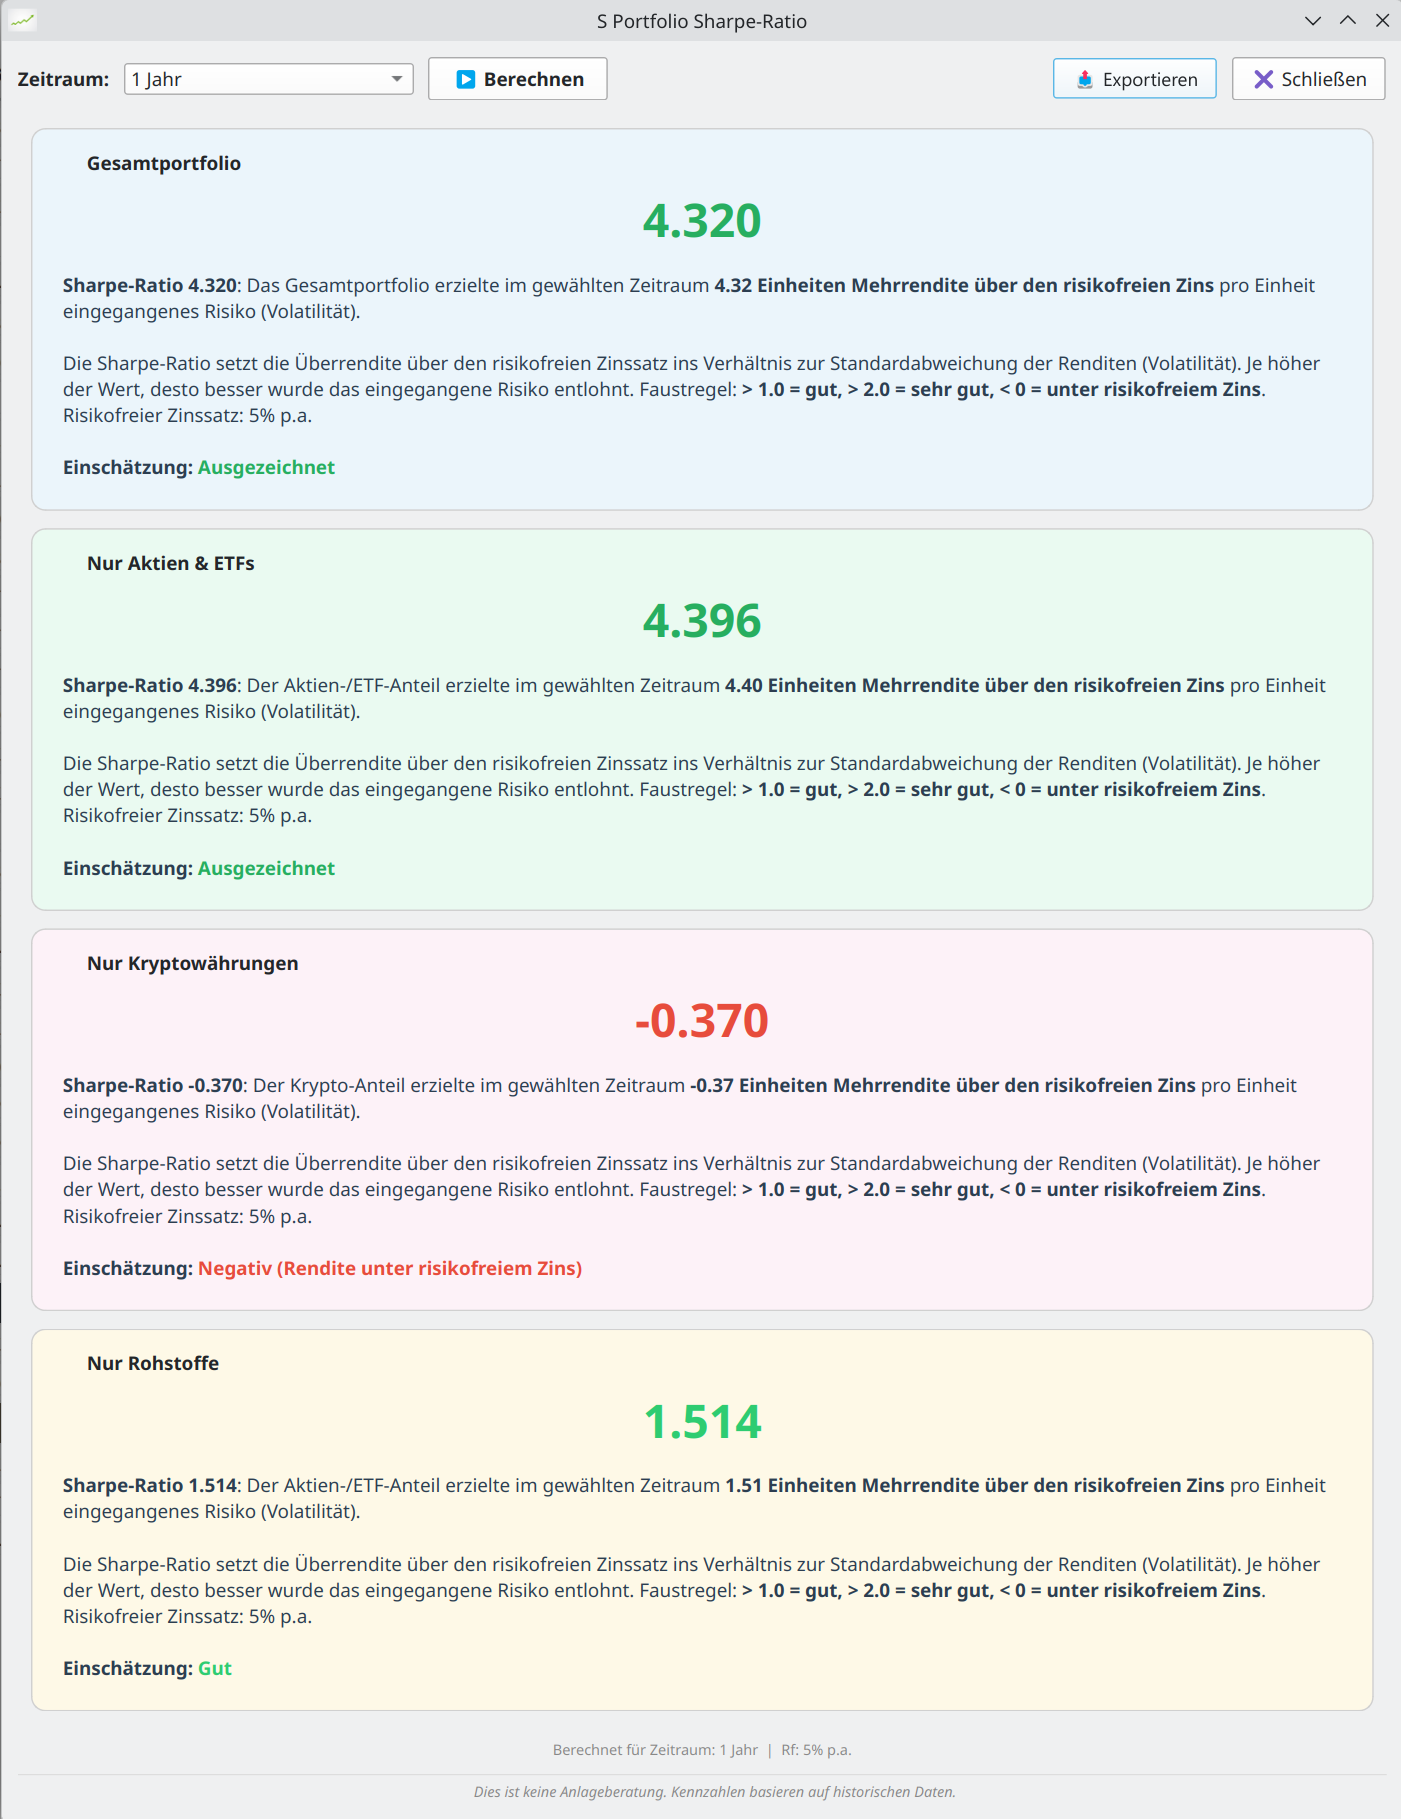
Institutionelle Risikokennzahlen für Privatanleger: Sharpe Ratio separat für Stocks, Crypto und Rohstoffe. Jensen's Alpha und Beta vs. S&P 500.

Institutional risk metrics for private investors: Sharpe Ratio separately for stocks, crypto and commodities. Jensen's Alpha and Beta vs. S&P 500.

  • Sharpe Ratio mit Bewertung (Excellent / Good / …)
  • Sharpe Ratio with assessment (Excellent / Good / …)
  • Alpha: Überrendite gegenüber Benchmark
  • Alpha: excess return vs. benchmark
  • Beta: Marktrisiko-Koeffizient pro Position
  • Beta: market risk coefficient per position
Vergleichs-Charts
Direkt beim Start Right at Startup

🔀 Vergleichs-Charts — 2 bis 6 Aktien gleichzeitig

🔀 Comparison Charts — 2 to 6 Stocks at Once

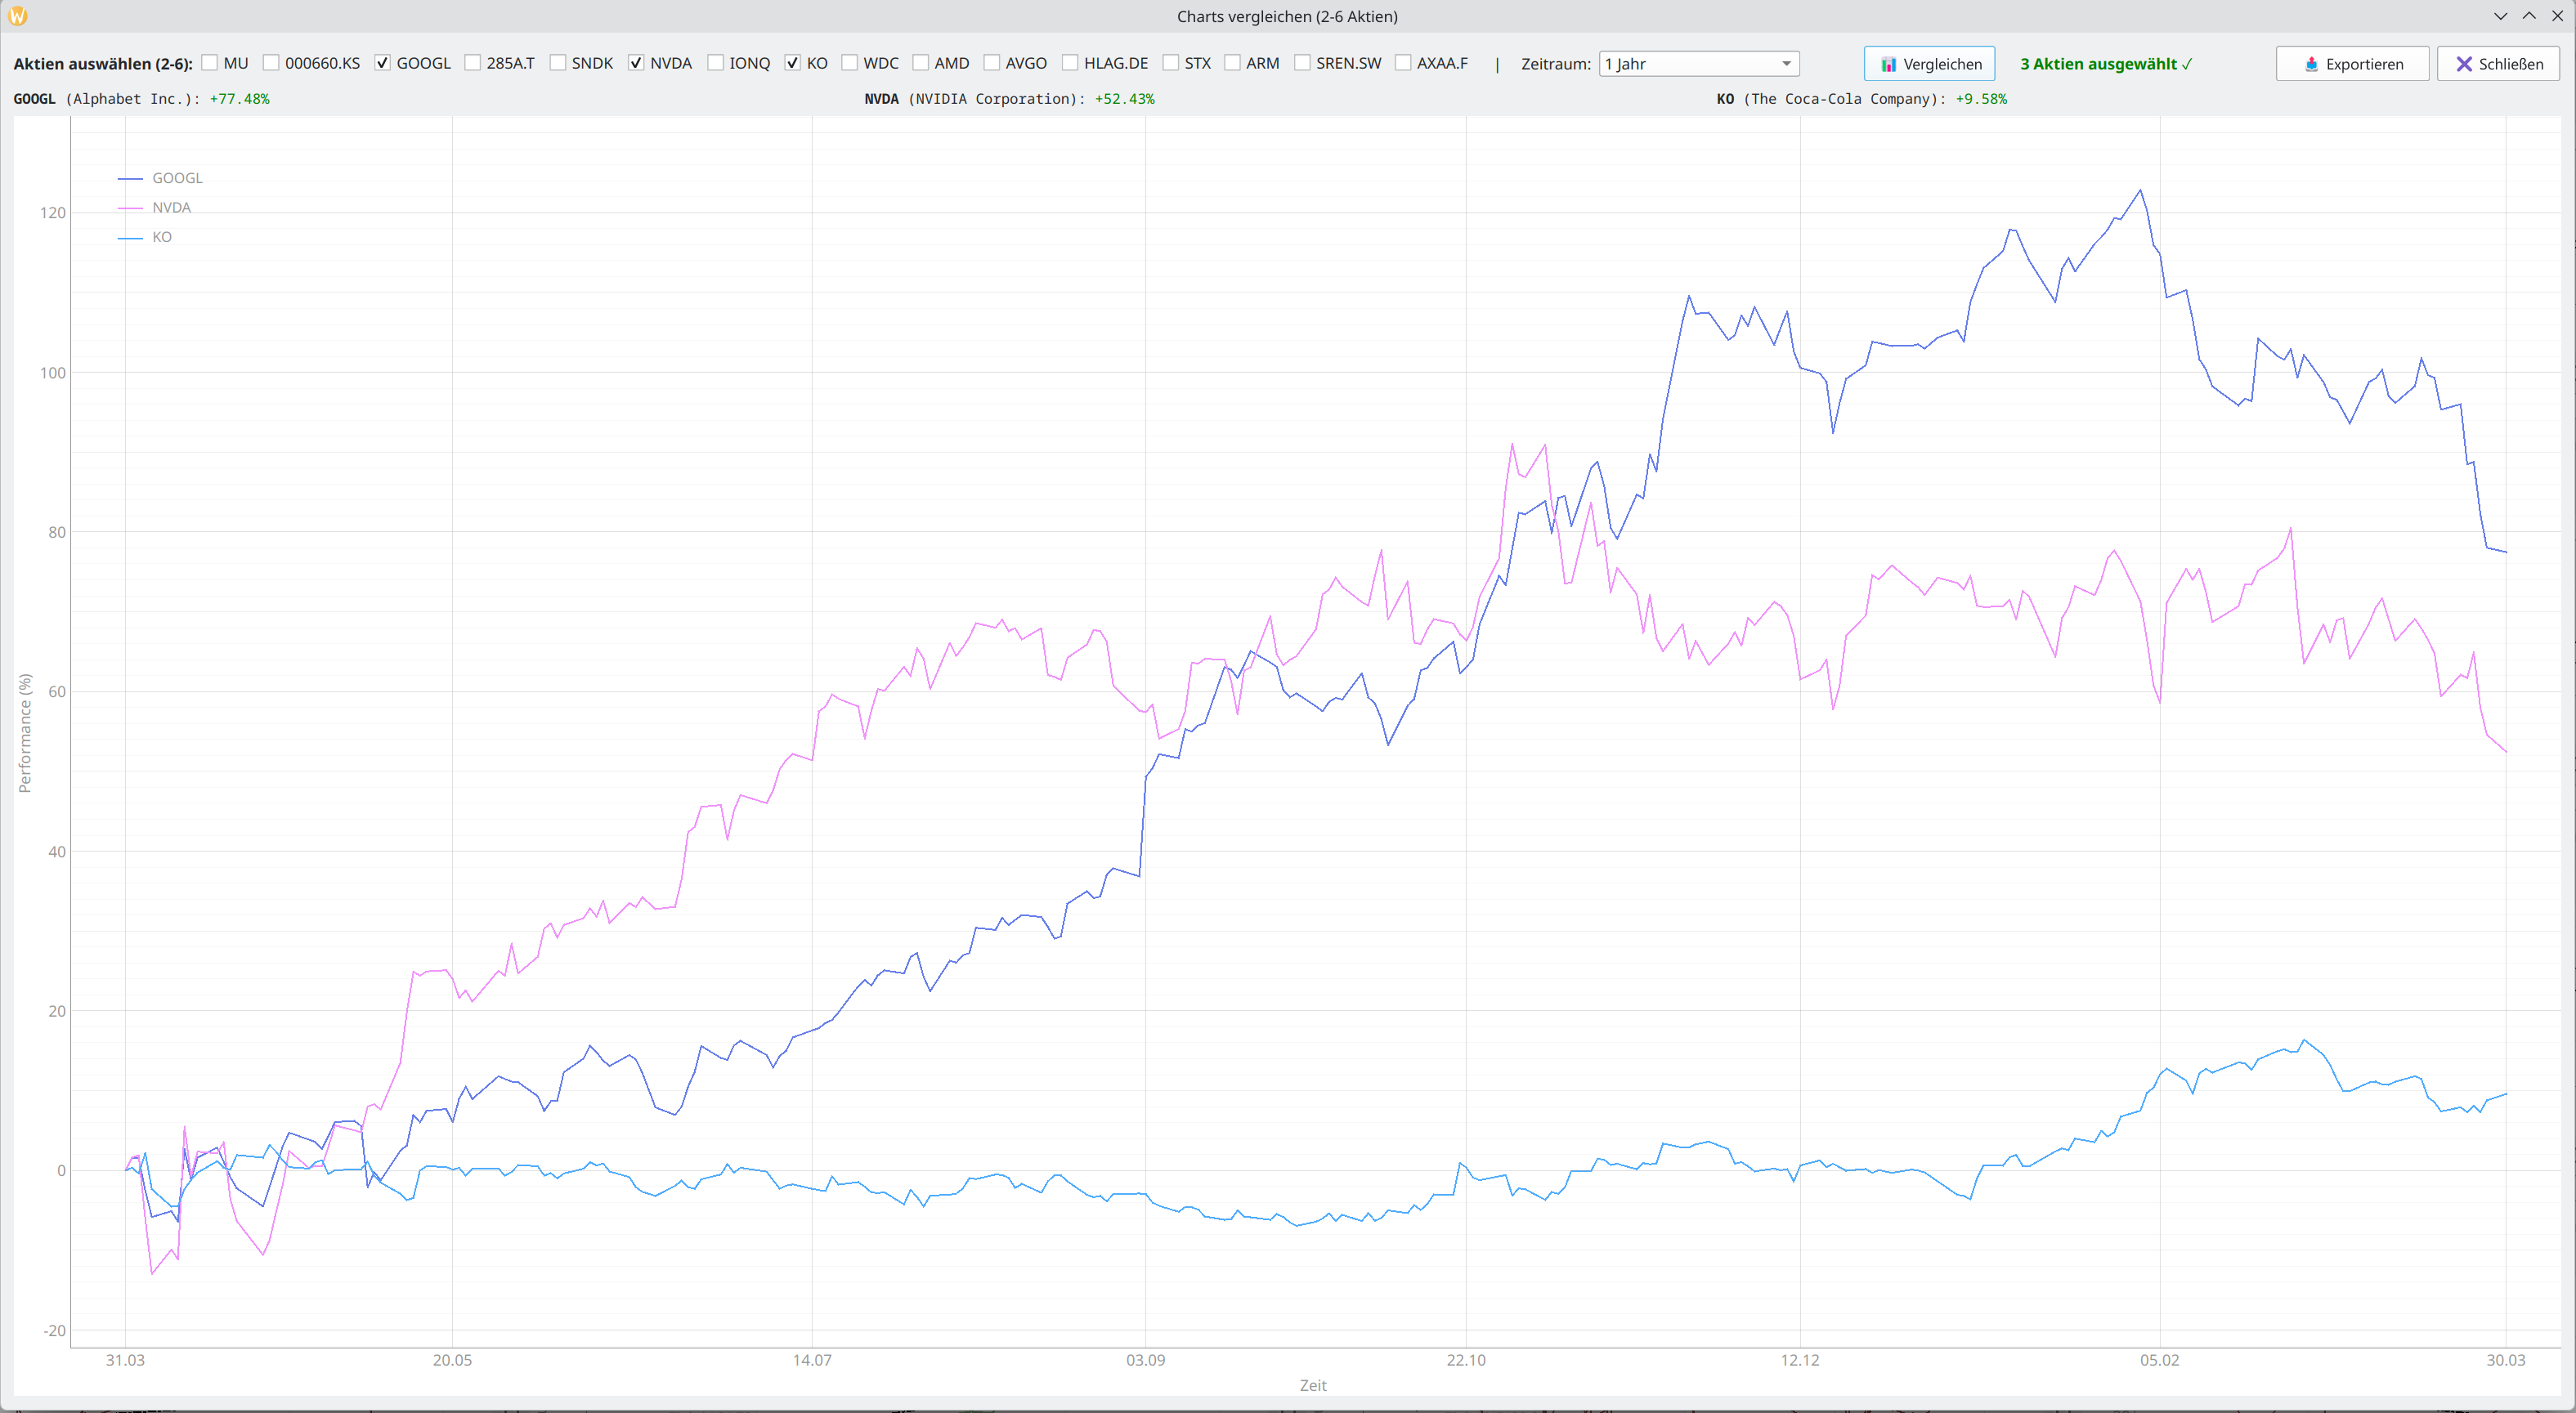
Der Vergleichs-Chart ist direkt beim App-Start sichtbar. Normierte Skala, damit du sofort siehst wer wirklich die Nase vorn hat — unabhängig vom absoluten Kursniveau.

The comparison chart is visible right at app startup. Normalized scale so you immediately see who's really ahead — regardless of absolute price levels.

  • 2–6 Symbole gleichzeitig auf normierter Basis (100 = Start)
  • 2–6 symbols simultaneously on normalized basis (100 = start)
  • Candlestick-Charts und Linien-Charts für Aktien, ETFs und Indizes
  • Candlestick and line charts for stocks, ETFs and indices
  • Crosshair-Tooltip zeigt alle Werte auf einmal
  • Crosshair tooltip shows all values at once
  • Y-Achsen-Lock & Session-Persistenz der Symbole
  • Y-axis lock & session persistence of symbols
Currency Converter
Währungs-Konverter Currency Converter

💱 27+ Währungen, Kryptowährungen & Edelmetalle

💱 27+ Currencies, Cryptos & Precious Metals

Yahoo Finance-Daten (15 Min. verzögert). Inklusive Kryptowährungen (BTC, ETH, XRP, SOL) und Edelmetalle (Gold, Silber, Platin, Palladium, Kupfer).

Price data via Yahoo Finance, ~15 min. delayed. Including cryptocurrencies (BTC, ETH, XRP, SOL) and precious metals (Gold, Silver, Platinum, Palladium, Copper).

  • USD, CHF, EUR, GBP, JPY, CAD, AUD und mehr
  • USD, CHF, EUR, GBP, JPY, CAD, AUD and more
  • XAU, XAG, XPT, XPD, XCU (Edelmetalle)
  • XAU, XAG, XPT, XPD, XCU (Precious Metals)
  • 15-Minuten-Kursverzögerung, Swap-Funktion
  • 15-minute price delay, swap function
Tax Module
Steuer-Assistent Tax Assistant

🧾 Steuer-Assistent — 5 Länder, PDF-Export

🧾 Tax Assistant — 5 Countries, PDF Export

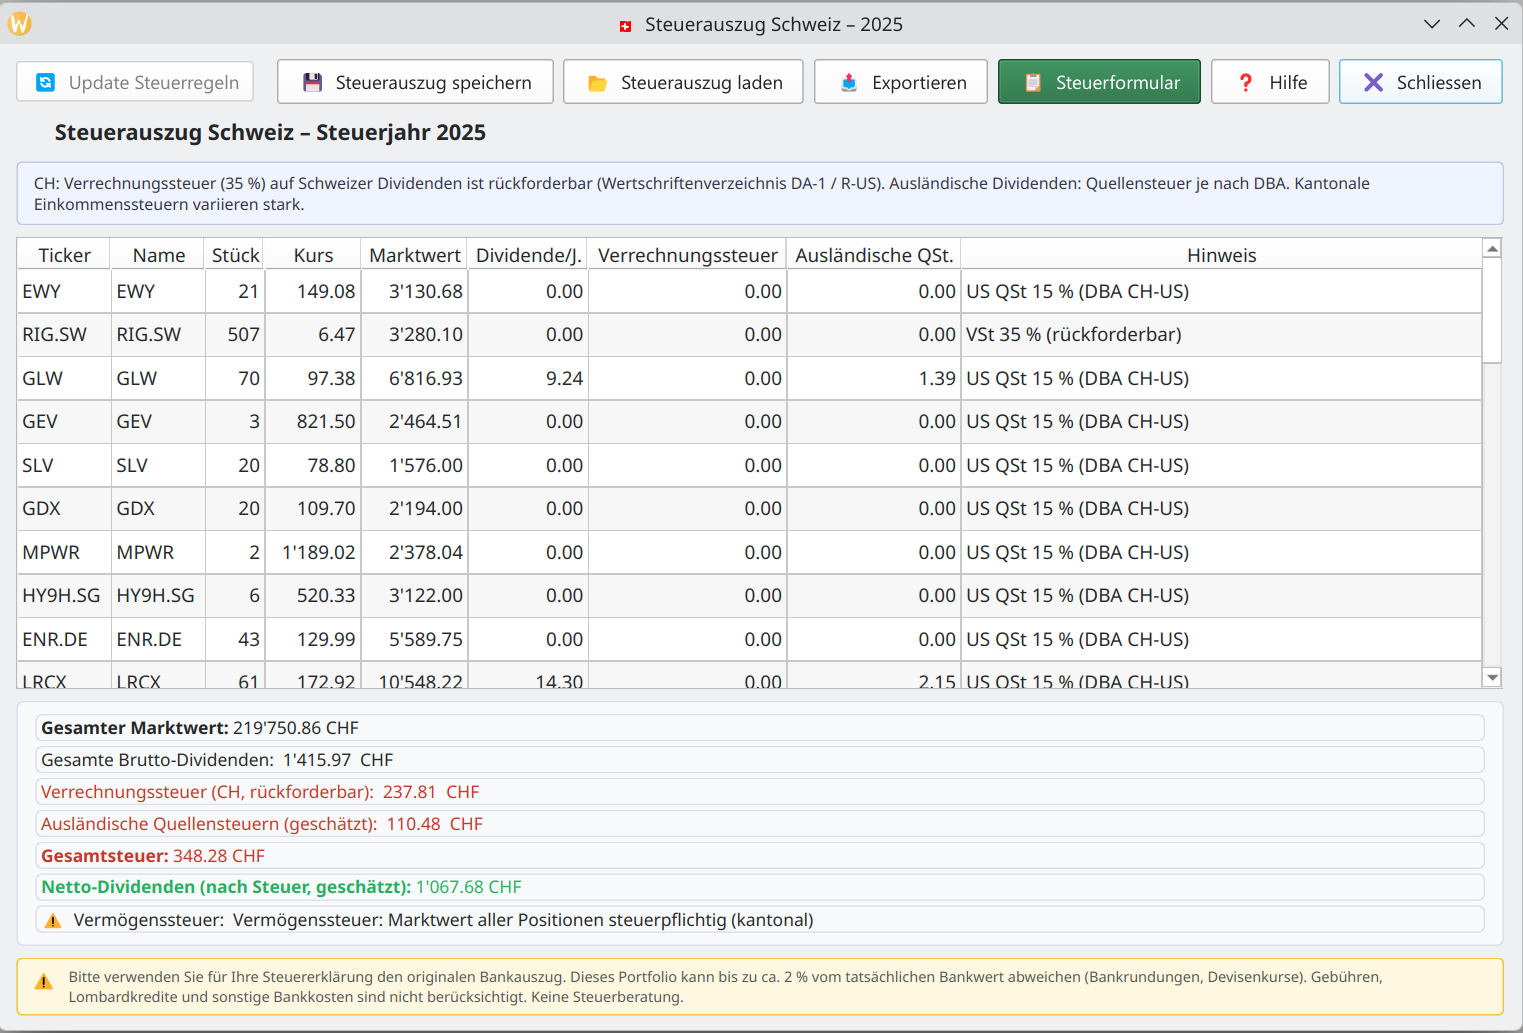
Stock Monitor berechnet automatisch Dividenden, Quellensteuern und Vermögenssteuern und exportiert länderspezifische Steuerformulare als PDF-Orientierungshilfe.

Stock Monitor automatically calculates dividends, withholding taxes and wealth taxes and exports country-specific tax forms as PDF orientation aids.

🇨🇭
Schweiz
DA-1 / Wertschriftenverzeichnis
DA-1 / Securities Schedule
🇩🇪
Deutschland
Anlage KAP
🇦🇹
Österreich
E1kv-Nachweis
🇬🇧
United Kingdom
SA108
🇺🇸
United States
Schedule B / Form 1040
Datenimport Data Import

📥 CSV-Import — mit geführtem Spalten-Mapping

📥 CSV Import — with Guided Column Mapping

Bankformat bekannt? Einfach importieren. Format unbekannt? Stock Monitor erkennt Spalten automatisch — oder führt dich Schritt für Schritt durch ein interaktives Mapping-Assistent. Keine Fehlersuche, keine manuellen Anpassungen.

Known bank format? Just import. Unknown format? Stock Monitor auto-detects columns — or walks you through an interactive mapping wizard step by step. No troubleshooting, no manual tweaks.

  • Swissquote — vollständig unterstützt inkl. Währungsumrechnung & FX-Kurse
  • Swissquote — fully supported including currency conversion & FX rates
  • DeGiro, Comdirect / ING, Flatex, Interactive Brokers, Trading 212 und mehr
  • DeGiro, Comdirect / ING, Flatex, Interactive Brokers, Trading 212 and more
  • Unbekanntes Format? Geführtes Spalten-Mapping — du klickst, Stock Monitor versteht
  • Unknown format? Guided column mapping — you click, Stock Monitor understands
  • Käufe, Verkäufe, Splits und Dividenden werden automatisch erkannt & korrekt zugeordnet
  • Buys, sells, splits and dividends automatically detected & correctly assigned
  • Kryptowährungen und Edelmetalle werden automatisch korrekt zugeordnet
  • Cryptocurrencies and precious metals are automatically mapped correctly
Chart-Detail Chart Detail

🕐 Börsenzeiten & Feiertage

🕐 Market Hours & Holidays

Direkt im gezoomten Chart: Ist die Börse gerade geöffnet oder geschlossen? Stock Monitor zeigt Öffnungszeiten, Pre-Market, After-Hours und alle Börsenfeiertage — für über 30 Börsen weltweit, automatisch erkannt am Ticker-Symbol.

Directly in the zoomed chart: Is the market currently open or closed? Stock Monitor shows opening hours, pre-market, after-hours and all market holidays — for over 30 exchanges worldwide, automatically detected from the ticker symbol.

  • 🟢 / 🔴 / 🟡 Echtzeit-Status — offen, geschlossen, Pre-Market oder After-Hours
  • 🟢 / 🔴 / 🟡 Real-time status — open, closed, pre-market or after-hours
  • Lokale Börsenzeit und deine Lokalzeit auf einen Blick
  • Local exchange time and your local time at a glance
  • Alle Börsenfeiertage des laufenden Jahres — inkl. nächster Öffnungstag
  • All market holidays for the current year — including next opening day
  • 30+ Börsen: NYSE/NASDAQ, SIX, XETRA, LSE, Euronext, Tokyo, Hongkong, ASX und mehr
  • 30+ exchanges: NYSE/NASDAQ, SIX, XETRA, LSE, Euronext, Tokyo, Hong Kong, ASX and more
  • Kryptowährungen: 24/7 — immer geöffnet
  • Cryptocurrencies: 24/7 — always open
⬇️

Download — v5.3.1

Download — v5.3.1

Kostenlos, Open Source, keine Installation nötig.

Free, open source, no installation required.

🪟 Download für WindowsDownload for Windows
ZIP entpacken → stock_monitor.exe starten — fertig. Keine Installation nötig. Erster Start: ca. 20 Sek. Ladezeit.
Extract ZIP → run stock_monitor.exe — that's it. No installation required. First launch: ~20 sec. loading time.
🐧 Linux
🐧 Linux
🐧 .rpm herunterladen (Fedora, openSUSE, Nobara u.a.) Download .rpm (Fedora, openSUSE, Nobara & more)
📱
Version 1.0
FX-Calc — Währungsrechner für Android
📱
Version 1.0
FX-Calc — Currency Converter for Android
📱 FX-Calc herunterladen (Android) Download FX-Calc (Android)
Datei öffnen und auf «Installieren» tippen. Installation aus unbekannten Quellen erlauben.
Open the file and tap "Install". Allow installation from unknown sources.
Quellcode auf GitHubSource Code on GitHub
📄 Dokumentation
📄 Documentation
Über neue Releases informiert werden:
Get notified about new releases:
Kein Spam. Nur bei neuen Releases. Keine Weitergabe an Dritte.
No spam. New releases only. Never shared with third parties.
Fragen & Feedback: info@stock-monitor.ch
Questions & Feedback: info@stock-monitor.ch
Timm
Über den Entwickler

Timm — Entwickler & Privatanleger

Ich bin Privatanleger und habe jahrelang verschiedene Portfolio-Tools ausprobiert — entweder fehlten wichtige Funktionen, die Bedienung war zu komplex, oder der CSV-Import funktionierte nicht wie erhofft. Dazu kam das manuelle Nachpflegen von Kursen, Splits und Dividenden. So entwickelte ich Stock Monitor — mit automatischen Kursdaten via Yahoo Finance. Dein Portfolio bleibt immer aktuell, ohne manuelles Nachpflegen. Als Kollegen die App sahen und sie ebenfalls nutzen wollten, entschied ich mich, sie als Open-Source-Projekt zu veröffentlichen.

⚠️ Haftungsausschluss: Stock Monitor ist ein Werkzeug zur persönlichen Portfolio-Analyse — keine Anlageberatung. Alle Investitionsentscheidungen liegen ausschliesslich beim Anleger. Der Entwickler übernimmt keine Haftung für finanzielle Verluste.